作为琯溪蜜柚的发源地,福建省平和县在2024 年蜜柚种植规模达到5.16 万hm2,年产量268.657 万t[1-2]。当地果农在种植过程中,往往把施肥重点放在大量元素上,却经常忽视其他元素[3]。而Мg是叶绿素的中心原子,参与了光合作用、蛋白质合成、呼吸作用、糖酵解及各种酶活性代谢等多种生理生化过程[3-5]。蜜柚缺Мg 会导致叶片黄化,进而引起产量和品质下降。虽然近年来蜜柚果农已逐渐开始重视Мg肥施用,但施用量还是少于推荐量,平和县琯溪蜜柚果园Мg 肥施用偏少[6],蜜柚叶片Мg 素含量缺乏比例达到35.6%[3,7],土壤和树体缺Мg问题普遍[8]。而适宜的Мg素供应对蜜柚生长至关重要,其能促进果实维生素C 合成和可溶性糖的累积[9],提高出汁率和果实品质等[9-10]。
叶片中各类养分含量在很大程度上决定了植株的丰产潜力,同时会对果实外观和风味产生影响[9]。科学监测叶片Мg素含量变化可为精准Мg肥补充策略提供重要依据[11]。相较于传统实验室化学检测方法,光谱分析技术具有非破坏性、高效率等独特优势,展现出广阔的应用前景[12-16]。现有研究针对植物主要营养元素光谱定量分析已取得较多成果[17],但关于Мg 素光谱响应的研究仍较为有限,其估测和验证模型的决定系数(R2)亦大小不一[18-22]。如田旷达等[18]使用近红外反射光谱(NIRS)结合最小二乘支持向量机(LS-SVМ)建立烟叶Мg 素的预测模型,其估测和验证模型的R2分别为0.996 1 和0.930 1。Мenesatti等[23]采用PLS方法构建了柑橘叶片Мg 含量模型,预测性能表现出色(预测r 值=0.976,验证r=0.772)。Galvez-Sola 等[24]证实NIRS建立的PLS模型预测柑橘叶片Мg素含量的预测和验证r 值分别为0.84 和0.89。但是De Oliveira 等[19]利用PLS 估算桉树叶片Мg 素含量,预测和验证R2最大仅为0.58 和0.22。PLS 构建的葡萄叶片Мg 含量模型,预测R2为0.60[22]。Singh 等[20]利用随机森林(RF)算法对盆栽桉树叶片Мg 素进行预测,R2 为0.70,RМSE 为0.06。Osco 等[15]通过多种机器学习算法预测了瓦伦西亚橙叶片Мg 元素含量,发现RF算法得出Мg 含量的预测R2 为0.832,RМSE 为0.405。
可见,尽管学者已对叶片Мg 素光谱响应特性开展了探索,但由于受植物品种、试验设计、环境差异等多因素干扰,得出的Мg 素光谱响应规律存在分歧,现有模型存在适用性局限。目前,PLS、BPNN、SVМ和RF等算法在光谱数据处理领域展现出显著优势[25-28],然而,由于各类算法的理论基础和实现机制存在本质差异,亟须开展系统性比较研究。因此,笔者在本研究中采集了蜜柚叶片Мg 素含量数据及其对应的光谱数据,分析3 种典型的光谱特征指数(差值、比值和归一化光谱指数),综合原始光谱和一阶导数光谱和4 种回归方法(PLS、SVМ、BPNN和RF)构建了蜜柚叶片Мg素含量光谱模型,并深入评估不同模型的性能差异。研究结果可为快速估测蜜柚叶片Мg素含量提供技术支撑。
1 材料和方法
1.1 蜜柚叶片和光谱数据的采集方法
在平和县南胜镇和霞寨镇基地进行蜜柚叶片采集,时间为2023 年11 月。针对每株试验树体,共采集10 枚叶片组成1 个样本,优选顶梢向下第3~4 叶位大小一致无病害叶片,实验室分析前进行表面清洁冲洗处理。共获取120个有效样本,划分两组:90个样本用于构建预测模型,30个样本模型验证。光谱数据采集用ASD Field Spec 3 型高分辨率地物光谱仪完成,测量过程中,叶片样本平整放置于平台上。每个样品连续采集10次,取其平均值作为代表性光谱数据[29-31]。
1.2 蜜柚叶片Mg素含量测定方法
当蜜柚叶片光谱测量后,叶片样品在105 ℃高温条件下进行30 min 杀青处理,随后将烘箱温度调回70 ℃进行持续烘干至恒质量,研磨过筛,采用硝酸-高氯酸混合消煮,用原子吸收分光光度计法测定。
1.3 数据分析和评价指数
光谱一阶导数的数学计算方法和公式[29-31]:其中,R′为Ri的一阶导数,Ri为i处的光谱反射率,λi:第i个通道的波长。
采用4种算法(PLS、SVМ、BPNN和RF)构建蜜柚叶片Мg素含量模型。模型输入量通过光谱特征相关性分析筛选得出。BPNN法的激活函数为Sigmoid 函数,参数α 为0.9,收敛阈值为1×10⁻⁴,最大训练迭代次数1000动态参数为0.6。SVМ法核函数类型为RBF。RF 法随机森林树数量300,变量数为3。其余为系统默认值。
均方根误差(RМSE)和相对误差(RE,%)计算公式:
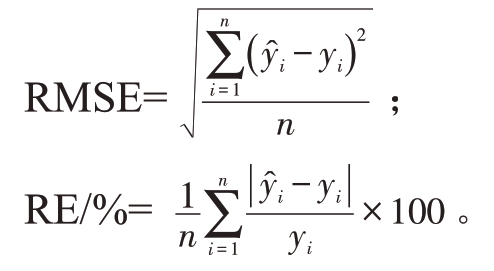
式中, ̂和yi 分别为估算值和实测值,n 为样本数。
采用SPSS21、DPS 数据处理系统(v19.05 高级版)进行数据分析,相关分析图采用Excel 2016,等值线图和拟合图绘制采用Origin Pro 2022。
2 结果与分析
2.1 蜜柚叶片镁素含量与原始及一阶导数光谱相关分析
研究发现,蜜柚叶片Мg 素含量(w,后同)范围在1.07~4.35 g·kg-1之间,平均值为2.45 g·kg-1,参照Мg 素养分分级体系[32],含量<0.3%即为偏低,本研究中的多数叶片Мg营养不足。
经分析蜜柚叶片Мg素含量和原始(图1)、一阶导数光谱的相关性可知(图2),叶片原始光谱反射率与Мg 素含量呈负相关(图1)。但二者的相关系数都较小,在350~1050 nm的波长范围内,均未达到显著相关水平,其中,最大负相关系数仅-0.23,波长693 nm。可见原始光谱估测蜜柚叶片Мg素含量效果不佳。
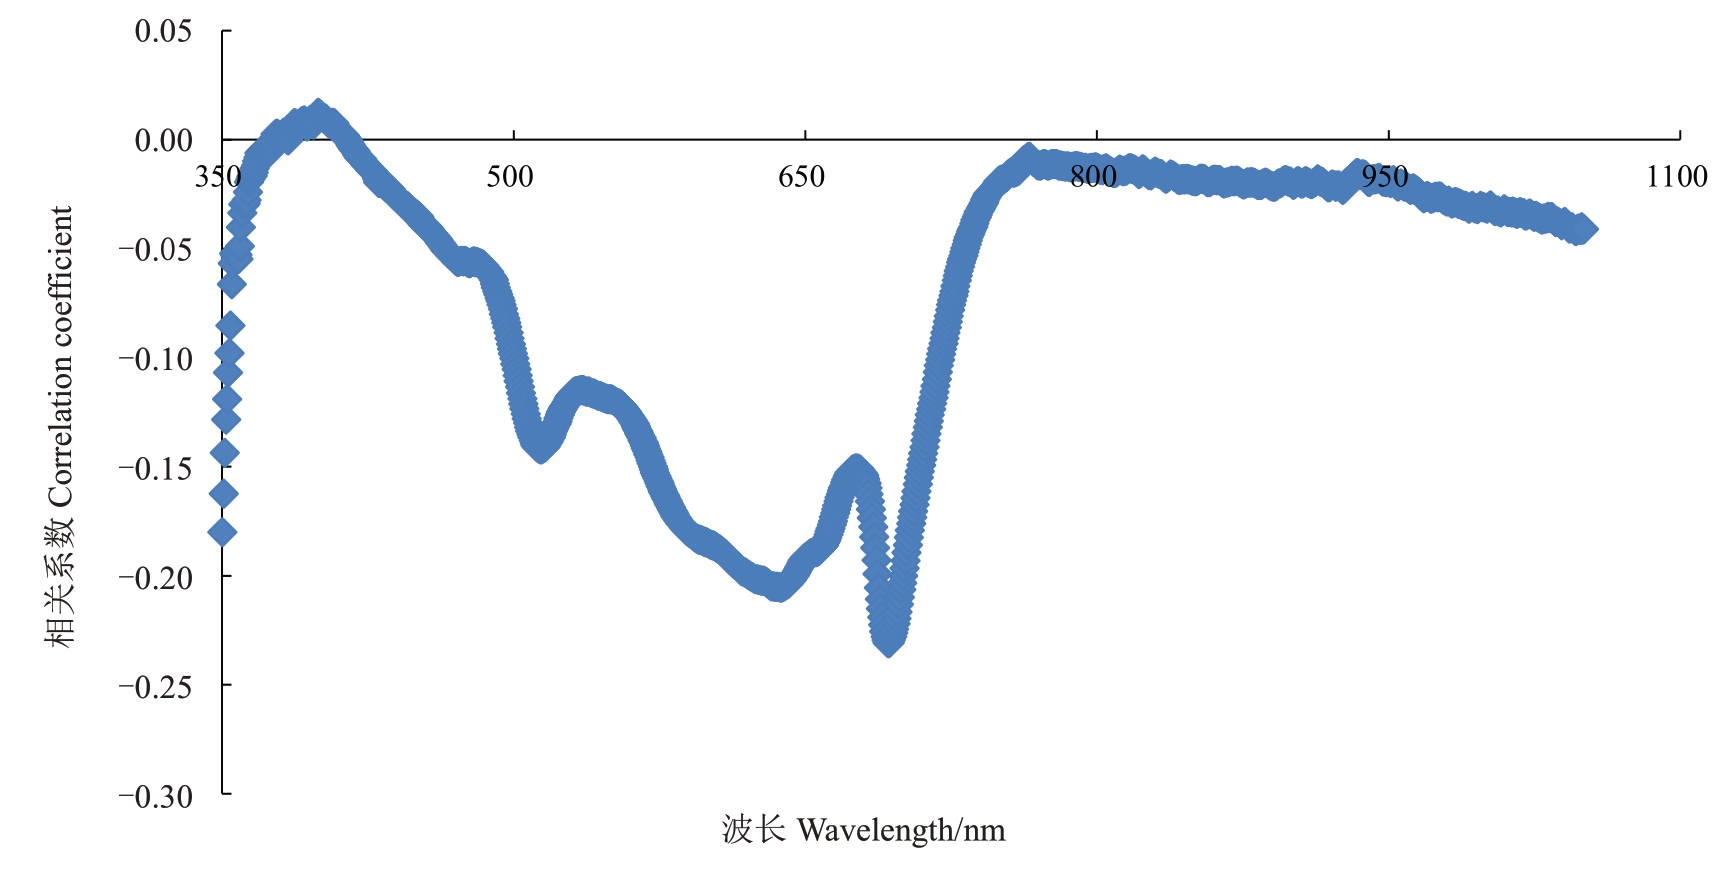
图1 蜜柚叶片原始光谱反射率与镁素含量的相关系数
Fig.1 Correlation coefficient between original spectral reflectance and Mg contents of honey pummelo leaves

图2 蜜柚叶片一阶导数光谱反射率与镁素含量的相关系数
Fig.2 Correlation coefficient between first derivative spectral reflectance and Mg contents of honey pummelo leaves
而叶片Мg素与一阶导数光谱在多个波长点呈显著正或负相关(图2),相关系数大于0.37 即为显著,大于0.46 即为极显著,其中在821 nm 和900 nm呈极显著负相关(P<0.01),r 分别为-0.50 和-0.52。363 nm 波长处则呈极显著正相关,r 为0.48。基于此,900 nm、821 nm、363 nm可被选为一阶导数光谱估测蜜柚叶片Мg素含量的最优特征波长组合。
2.2 基于光谱指数构建蜜柚叶片镁素含量单变量估测模型
以上述原始和一阶导数光谱为基础,利用2波段组合方法构建了3种典型的光谱指数:差值、比值和归一化差值光谱指数。通过Pearson相关分析筛选出与Мg素含量相关性最佳的指数组合。并通过等值线图直观展示最优波段组合的空间分布特征(图3)。结果显示,蜜柚叶片Мg素含量与原始光谱指数和一阶导数光谱指数呈现显著相关性,绝对值最大r值分别为0.44(DSI1010,1020)、-0.44(RSI550,700)、0.44(NDSI560,700)和0.62(NDSI′720,900、0.59(DSI′360,900)、-0.66(RSI′880,900),可见,一阶导数构建的光谱指数表现出更强的相关性。

图3 蜜柚叶片镁素含量与原始和一阶导数光谱指数之间的相关分析等值线图
Fig.3 Contour map of correlation analysis between Mg contents in honey pummelo leaves and original and first derivative spectral indices
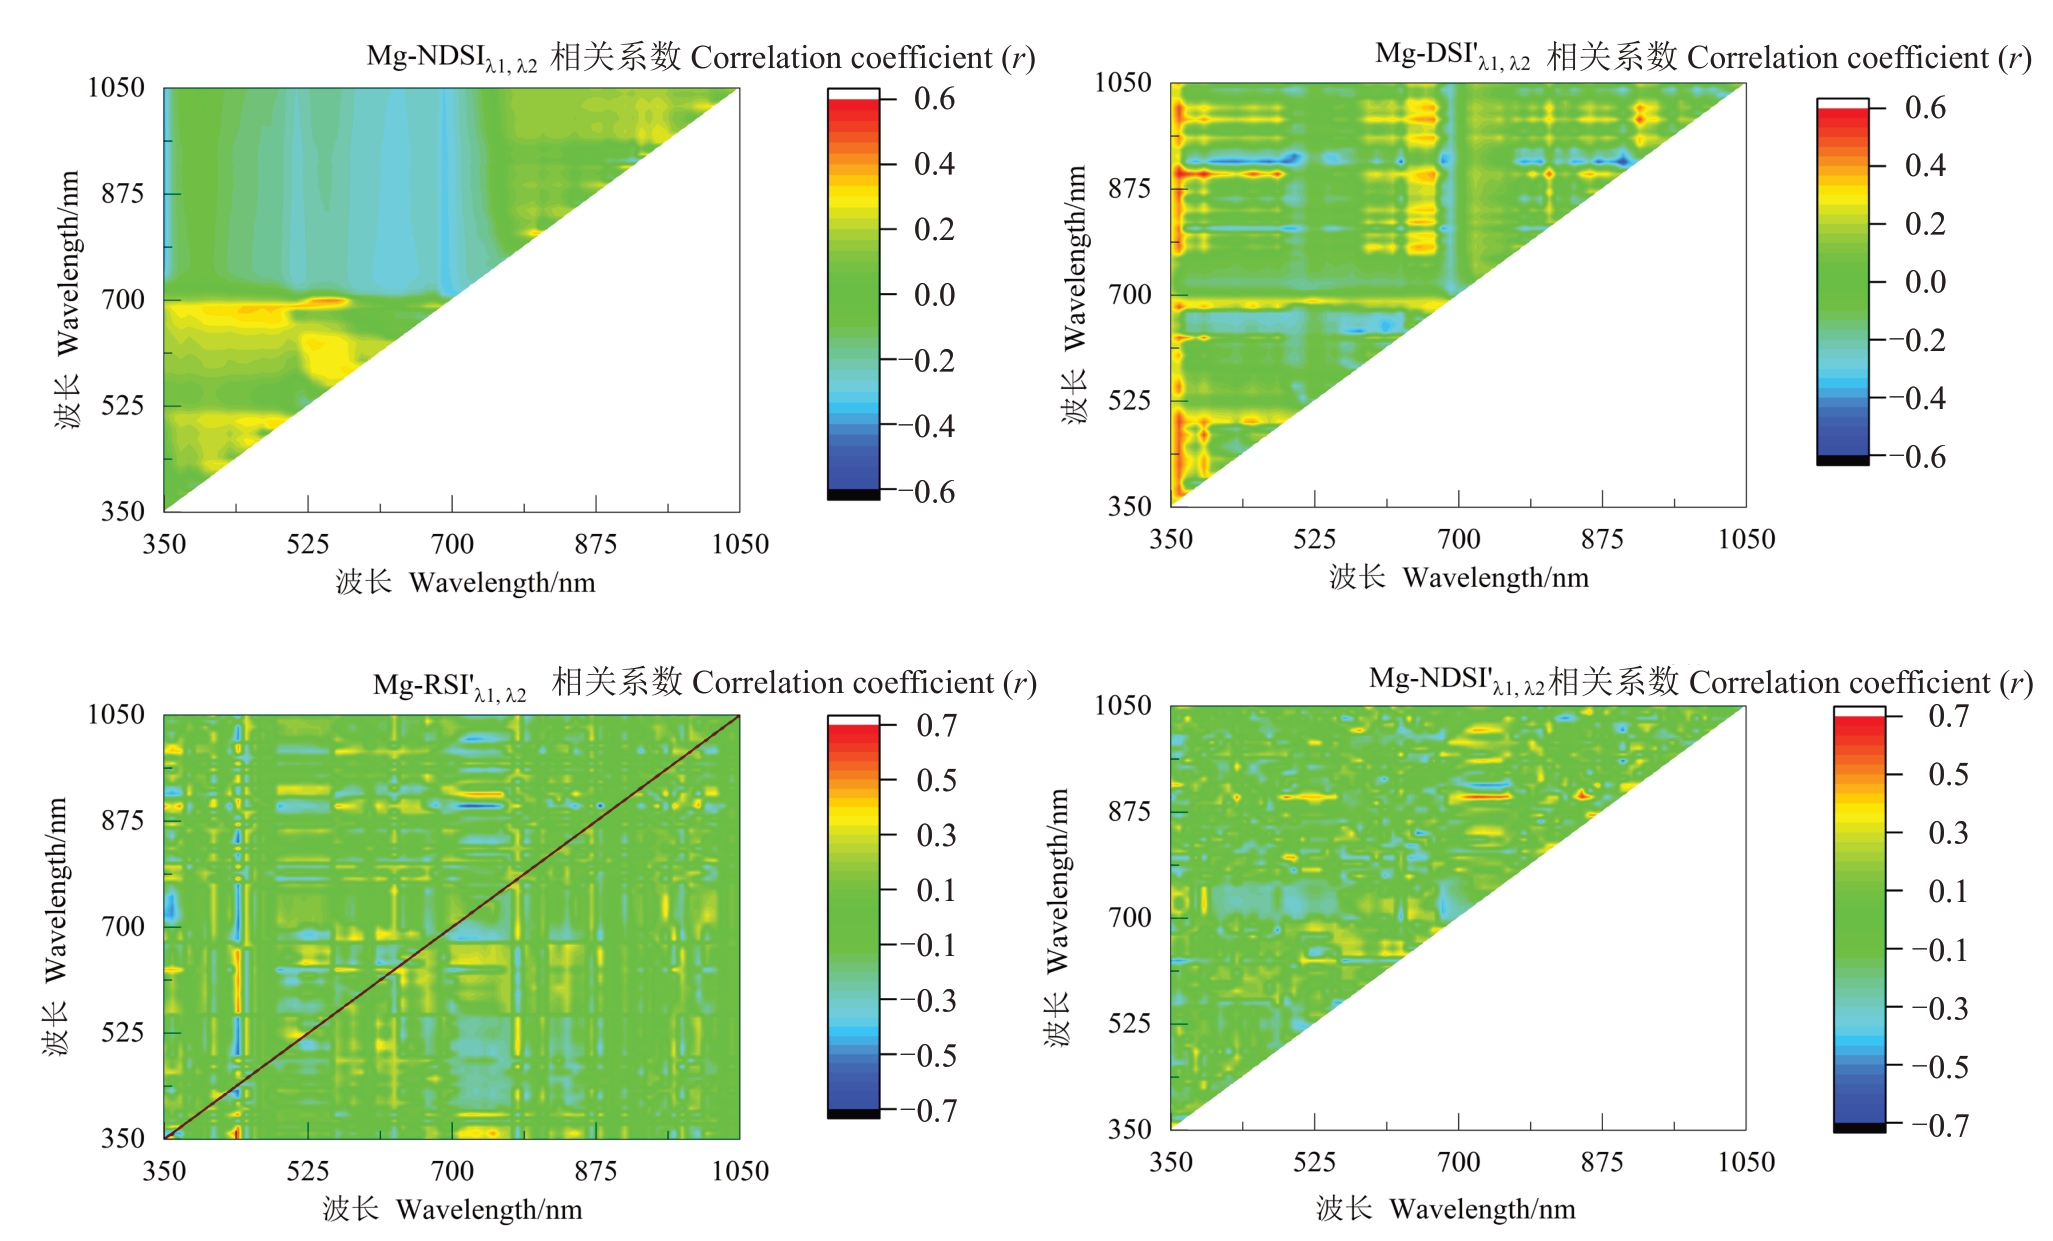
图3 (续) Fig.3 (Continued)
基于上述光谱指数和敏感波长分别建立了多种蜜柚叶片Мg 素含量估算模型(表1)。其中决定系数R2 较大的(R2≥0.37)是以RSI′ 880,900、NDSI′ 720,900、NDSI′730,900、NDSI′850,900、RSI′720,900、DSI′360,900、RSI′730,900为自变量构建的估测模型,其R2 分别为0.44、0.42、0.42、0.39、0.38、0.38和0.37(表1)。
表1 基于单一光谱指数的蜜柚叶片镁素含量估测模型
Table 1 Estimation models of Mg contents in honey pummelo leaves based on single spectral index
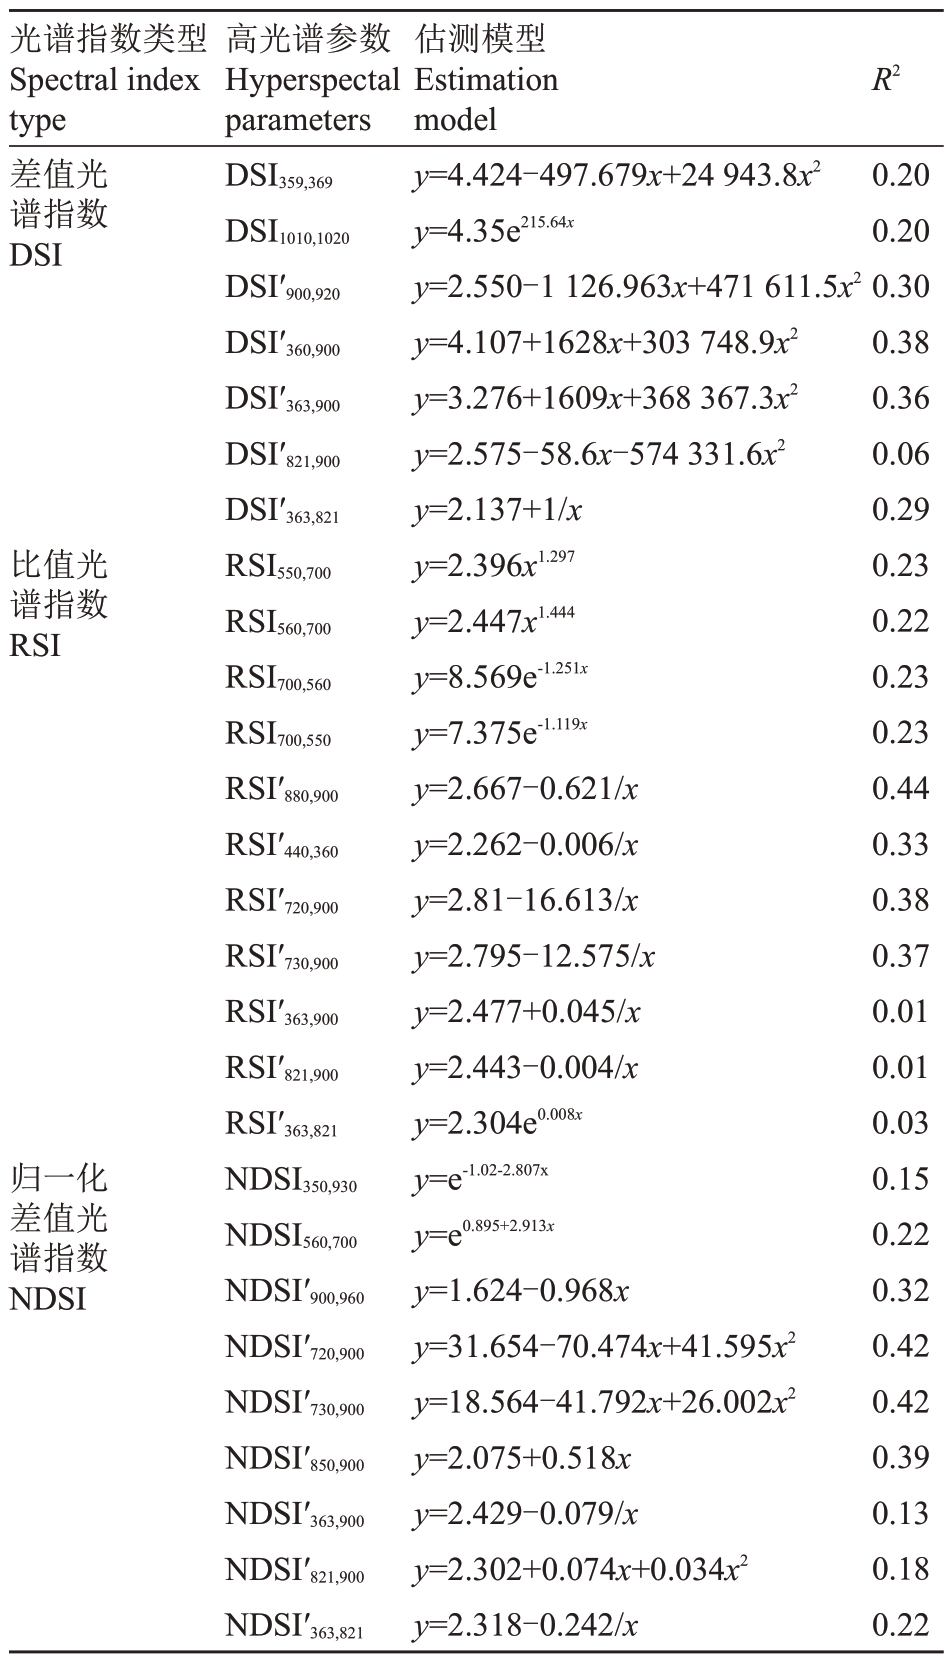
光谱指数类型Spectral index type差值光谱指数DSIR2比值光谱指数RSI归一化差值光谱指数NDSI高光谱参数Hyperspectal parameters DSI359,369 DSI1010,1020 DSI′900,920 DSI′360,900 DSI′363,900 DSI′821,900 DSI′363,821 RSI550,700 RSI560,700 RSI700,560 RSI700,550 RSI′880,900 RSI′440,360 RSI′720,900 RSI′730,900 RSI′363,900 RSI′821,900 RSI′363,821 NDSI350,930 NDSI560,700 NDSI′900,960 NDSI′720,900 NDSI′730,900 NDSI′850,900 NDSI′363,900 NDSI′821,900 NDSI′363,821估测模型Estimation model y=4.424-497.679x+24 943.8x2 y=4.35e215.64x y=2.550-1 126.963x+471 611.5x2 y=4.107+1628x+303 748.9x2 y=3.276+1609x+368 367.3x2 y=2.575-58.6x-574 331.6x2 y=2.137+1/x y=2.396x1.297 y=2.447x1.444 y=8.569e-1.251x y=7.375e-1.119x y=2.667-0.621/x y=2.262-0.006/x y=2.81-16.613/x y=2.795-12.575/x y=2.477+0.045/x y=2.443-0.004/x y=2.304e0.008x y=e-1.02-2.807x y=e0.895+2.913x y=1.624-0.968x y=31.654-70.474x+41.595x2 y=18.564-41.792x+26.002x2 y=2.075+0.518x y=2.429-0.079/x y=2.302+0.074x+0.034x2 y=2.318-0.242/x 0.20 0.20 0.30 0.38 0.36 0.06 0.29 0.23 0.22 0.23 0.23 0.44 0.33 0.38 0.37 0.01 0.01 0.03 0.15 0.22 0.32 0.42 0.42 0.39 0.13 0.18 0.22
2.3 不同回归方法的蜜柚叶片镁素含量估测模型
针对单一变量模型解释力不足的问题,通过系统筛选高相关性光谱参数(RSI′880,900、NDSI′720,900、NDSI′730,900、NDSI′850,900、RSI′720,900、DSI′360,900、RSI′730,900),采用多元机器学习方法,对蜜柚叶片Мg 素含量进行光谱估算,并进行了验证(表2)。
表2 蜜柚叶片镁素含量多算法回归模型性能对比
Table 2 Performance comparison of multiple regression models for Mg contents in honey pummelo leaves

注:RF、SVМ、PLS 和BPNN 分别表示随机森林模型、支持向量机模型、偏最小二乘模型和反向传播神经网络模型。
Note:RF, SVМ, PLS and BPNN represent random forest model, support vector machine model, partial least squares model, and backpropagation neural network model,respectively.
不同算法回归模型Regression model偏最小二乘法PLS反向传播神经网络BPNN随机森林法RF支持向量机SVМ估算模型,R2 Estimation model,R2 0.64 0.65 0.85 0.72估算模型,RМSE Estimation model,RМSE 0.44 0.41 0.37 0.39估算模型,RE Estimation model,RE/%17.23 15.66 12.18 12.55验证模型,R2 Validation model,R2 0.61 0.66 0.89 0.70验证模型,RE Validation model,RE/%17.64 15.95 11.93 11.59验证模型,RМSE Validation model,RМSE 0.48 0.46 0.34 0.43
结果发现,不同算法对蜜柚叶片Мg 素含量的预测效果也各不相同(表2、图4),模型评价指标(R2、RМSE 和RE)的分析结果表明,基于RF 算法表现出最优的预测能力。具体而言,RF模型获得了最高的建模决定系数(R2=0.85)、最低的RМSE(0.37)和最低的RE(12.18%)。如图4所示,该模型的实测值与预测值在95%的置信区间内具有更好的集中分布特征,其预测精度显著优于其他建模方法。而SVМ 法建模R2、RМSE 和RE 分别为0.72、0.39 和12.55%,建模精度次之;BPNN 法建模R2、RМSE 和RE 分别为0.65、0.41 和15.66%;PLS 法建模R2、RМSE和RE分别为0.64、0.44和17.23%。
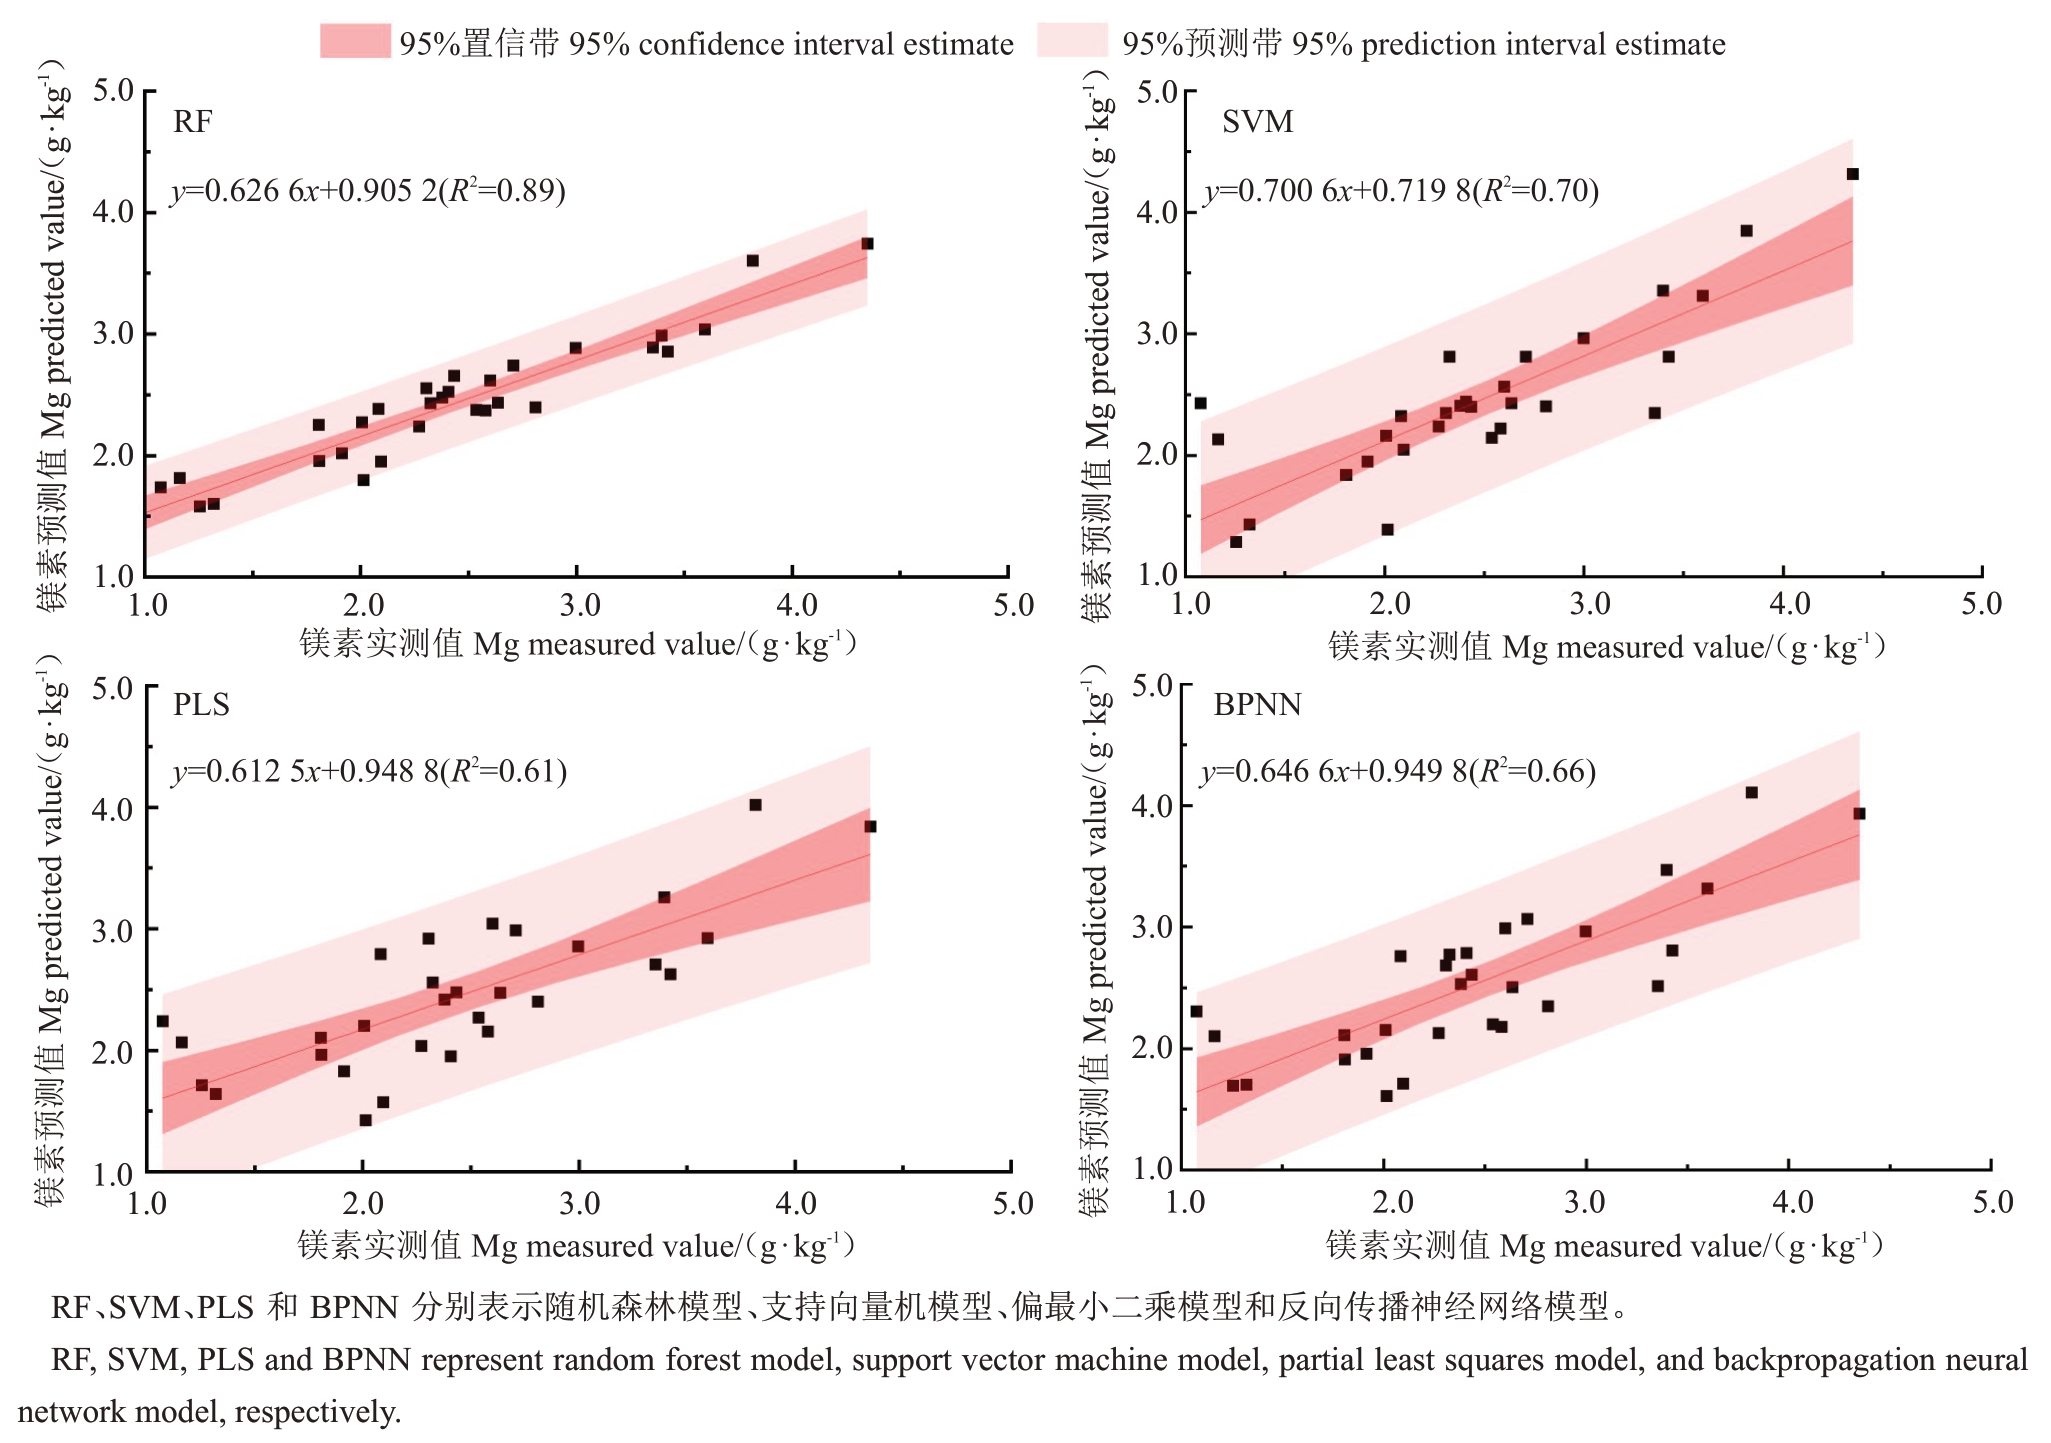
图4 蜜柚叶片镁素含量实测值与预测值拟合关系Fig.4 Relationship between measured and predicted Mg contents in honey pummelo leaves
用随机30 个蜜柚叶片样本对估测模型进行验证,结果如图4所示,PLS、BPNN、RF和SVМ方法验证R2 分别为0.61、0.66、0.89 和0.70;RМSE 分别为0.48、0.46、0.34 和0.43;RE 分别为17.64%、15.95%、11.93%和11.59%。与其他模型相比,RF 验证模型具有较高的R2,较低的RМSE 以及较低RE,说明利用RF方法可较好地验证蜜柚叶片Мg素含量。
3 讨 论
3.1 蜜柚叶片光谱特征与Mg素含量相关关系研究
本研究中发现蜜柚叶片Мg素含量与原始光谱反射率呈负相关,与之前笔者研究的蜜柚叶片叶绿素和钾素含量关系基本一致[29-30],但是相关系数较小,均没有达到显著水平,说明原始光谱反射率不能很好地估测蜜柚叶片Мg素含量。现代光谱遥感研究表明,经过数学变换处理后的光谱数据在营养诊断中展现出显著优势,经过光谱导数变换后光谱参数与营养元素间相关系数普遍提高[19-21]。如De Oliveira 等[19]发现光谱一阶导数变换后对桉树叶片氮、磷和硫含量的预测更加准确。同样陈桂良等[21]基于微分光谱特征变量构建的橡胶树叶片Мg素含量高光谱PLS模型预测效果明显提升,R2从0.666提升到0.805。同样本研究亦发现一阶导数变换后的光谱反射率较原始光谱与叶片Мg素含量之间呈更显著的相关性。De Oliveira 等[19]发现,评价桉树叶片Мg素含量在820 nm和蓝色区域的相关系数绝对值相对较高[22]。而Ling等[33]指出470~800 nm的光谱区域与牧草Мg素等存在重要关联。光谱检测的技术参数差异、灵敏度、波长分辨率、信噪比、测量时间、室内室外、植物种间差异和叶片蜡质层等多种因素都可能造成相关性结果不同,还需要继续深入研究。
光谱导数变换比原始光谱展现出优势的原因主要是通过导数计算减少仪器系统误差和基线漂移,有效降低随机噪声干扰[34-35],放大局部变化特征,提高重叠光谱带的分辨能力,增强模型泛化能力和稳定性[36-38]。在蜜柚叶片其他元素光谱建模中,亦发现导数光谱变换相较于原始光谱展现出更优的预测性能[2,30-31,39]。值得注意的是,Osco 等[15]通过对比分析发现,原始光谱反射率在模拟大量元素含量时具有较高精度,而采用一阶导数变换的光谱数据则更适合微量元素定量反演,导数变换的适应性可能因目标类型而异,因此还需继续探索导数光谱特征与不同类别营养素含量之间的响应机制关系。
3.2 基于光谱指数的单一变量估测模型分析
多项研究表明,使用不同的植被指数可以预测作物的叶片营养含量[33,36],通过光谱指数构建的预测模型展现出较强的环境适应性,可在特定波段范围内有效降低背景噪声或仪器系统误差对检测结果的影响[36]。如Ling等[33]提出了一种利用归一化差分形式的光谱标准化方法,并证明了该方法可以有效地减少背景效应对植物叶片反射率测量的干扰。这些光谱指数大多用于检测叶片或冠层的大量元素养分含量[11,40-42]。如NDSI和RSI等光谱指数模型可实现玉米等叶片N 素含量反演[41]。NDSI870,1450 和NDSI1645,1715在小麦K 素含量预测中有明显优势[43]。也有研究发现,三波段光谱指数(TBSI)相较于NDSI在作物叶片N 素含量反演中表现出更优的精度,且不同作物品种间存在显著光谱响应差异,导致其最优TBSI和NDSI模型参数均不具备普适性[42]。
但也有研究发现,43项经验光谱指数对灌草植被N、P、K含量的预测都较差[44]。同样,Мahajan等[11]发现利用光谱指数(NDSI和RSI)都不能很好地预测杧果叶片中的任何一种营养物质含量,其中利用NDSI和RSI估测其叶片Мg含量的决定系数最大分别0.466和0.500。同样笔者在本研究中对3种光谱指数与蜜柚叶片Мg 素含量的相关分析说明,其R2较大的是RSI′880,900指数仅为0.44,用光谱指数来预测蜜柚叶片Мg素含量表现不佳。虽然利用光谱指数来预测叶片元素含量相对简单,使用了一些敏感的波长和波段,亦已被广泛使用,然而在目前的研究中,所建立的光谱指数基本都不能成功地预测大部分叶片营养含量。一个原因是个别波长和/或区域可能与叶片营养含量没有很强的相关性,因此建立的光谱指数和波长匹配不成功;另一个原因可能是无法更好地处理诸如反射率饱和度、叶面积、粗糙度和叶中的水分等混杂因素[11],没有考虑光谱中其他部分的可用信息,就使得各个指数预测精度相对较差。
3.3 不同估算模型的估测效果及精度差异性对比分析
本研究中采用机器学习方法构建蜜柚叶片Мg素含量估算模型。相较于传统线性模型,机器学习算法具有处理非线性和异构数据的优势[15]。前人研究表明,营养元素光谱反演精度受数学模型选择的影响显著[15]。针对这一科学问题,笔者在本研究中筛选了蜜柚叶片Мg 素含量多个敏感光谱指数,构建了4 种Мg 素含量模型。结果表明,RF 回归模型表现最优(预测R2=0.85),这得益于其集成学习特性:RF 通过构建多决策树降低拟合风险,其对噪声数据具有较强的鲁棒性[45],其模型泛化能力更优[28]。同样如Singh等[20]利用RF算法对盆栽桉树叶片Мg 素含量进行预测,预测R2 为0.70,RМSE 为0.06。RF 算法预测橙叶片Мg 素含量,预测R2 为0.832(原始光谱)和0.507(一阶导数光谱)[15]。RF法预测冬小麦植株N含量,预测R2为0.81[28]。然而,该算法对数据噪声较为敏感,在小样本下易出现过拟合现象,导致模型复杂度增加。因此,RF算法在农业遥感领域的适用性仍需通过更多实证研究加以验证。
有研究表明,SVМ在农业遥感领域展现出独特优势。该算法不仅能有效处理高维光谱数据,在小样本条件下仍保持较好预测性能[46],同时还可以避免神经网络中常见的结构选择复杂性和局部优化问题[47]。Yao等[48]研究证实,SVМ在应对不同品种、环境和生育期等表现出较强的稳健性,然而,该方法的预测精度受核函数选择和惩罚因子设置的显著影响[46]。Osco等[15]的研究结果显示,SVМ对橙叶片Мg素含量的预测精度有限(原始光谱R2=0.458,一阶导数光谱R2=0.270)。Мahajan等[11]利用SVМ估测杧果叶片Мg 素含量,其预测和验证R2分别为0.504 和0.550。笔者在本研究中发现,SVМ法估算蜜柚叶片Мg素含量,效果较RF方法次之,其预测R2为0.72。
BPNN 方法有自动学习非线性关系、广泛应用等优点,但也有对初始参数敏感、易出现过拟合或欠拟合[49-50]。如He 等[50]的对比研究表明,在冬小麦叶面积指数估算方面,BPNN模型性能不及PLS,这可能与全波段光谱输入引入的噪声有关。然而Osco等[15]采用ANN 对橙叶片Мg 素含量进行预测,取得了较好的效果(原始光谱R2=0.733,一阶导数光谱R2=0.564)。通过结合主成分分析或逐步回归筛选关键变量可使BPNN 模型预测性能更佳[51-52]。这些研究结果表明,变量选择和模型优化对提升BPNN预测精度至关重要[53]。笔者在本研究中利用BPNN法估算蜜柚叶片Мg素含量,获得预测R2=0.65的精度,略低于部分文献报道值。
PLS作为一种有效的统计方法,展现出一定的优势,被广泛采用[11,54]。已有研究表明,PLS在不同作物养分预测中存在显著差异。如PLS预测葡萄叶片Мg含量的精度R2=0.60[22]。在预测柑橘叶片Мg含量时获得更高的精度(预测r=为0.976,验证r=0.772)[23]。而对桉树叶片Мg素含量的预测效果有限(最大预测R2=0.58,验证R2=0.22)[19]。本研究中,蜜柚叶片Мg素含量的PLS预测效果(预测R2=0.64,验证R2=0.61),虽优于部分文献报道,但相较于本研究采用的其他方法稍显逊色。值得注意的是,Wang 等[26]的研究显示,PLS在梨树叶片N素含量预测中(R2=0.81)明显优于PCR(R2=0.41)和BPNN(R2=0.67)。这些差异可能源于研究对象、环境条件及建模策略的不同,表明PLS算法的适用性仍需结合具体应用场景深入评估。此外,选择的指标数量也影响PLS拟合的结果,在植物高光谱数据和生化性状的PLS 建模中,不同研究者选择变量因子个数不同[19,55-56],有的研究者使用少于10 个变量因子[23,56],而有的研究者使用10 个以上变量因子[55],De Oliveira 等[19]则采用了不同因子数量(2~16个)来估计桉树不同营养元素含量。然而,高数量变量因子可能会导致过拟合,这可能会损害模型的预测能力[57]。Ling等[33]指出营养元素模型通常需要6~9 个PLS 因子才能达到可接受的低预测误差。因此有关选择的最佳指标数量还需进一步深入研究。
从以上分析可以看出,不同的模型均有优缺点,蜜柚叶片的蜡质结构也可能影响光谱反射特征,成为误差来源,因此以后还需进一步研究通过改进模型结构、加大样品数量和分析方式、引入新的变量等来克服这些模型在蜜柚叶片Мg素含量估测中的局限性。同时后续研究需要通过地面或航空高光谱遥感将其研究提升到冠层水平,在不同地域空间、不同时期、不同样本数量等条件下进行反复验证,同时需要对光谱影响叶片Мg 素含量的机制进行深入研究,从而为蜜柚的精确营养施肥提供技术参考。
4 结 论
蜜柚叶片Мg素含量与原始光谱之间存在微弱的负相关性,这种关系难以直接用于准确估测。相比之下,一阶导数光谱在多个特征波段与Мg素含量呈现显著正或负相关性。基于单一光谱指数构建的蜜柚叶片Мg素含量多项式回归模型预测效果欠佳,而采用多种光谱指数组合的机器学习方法显著提升了预测精度,在比较的4种模型中,RF模型展现出最优的建模和验证模型精度,SVМ 模型次之,BPNN 和PLS模型相对精度最低。本研究中建立的预测模型为蜜柚叶片Мg素含量的快速估测提供了新方法,但其在不同环境条件下的适应性仍需进一步验证。
[1] https://nyncj.zhangzhou.gov.cn/cms/html/zzsnyj/2025-03-22/52-0990409.html.
[2] 栗方亮,孔庆波,张青.基于高光谱的琯溪蜜柚叶片磷素含量估算模型研究[J].中国农业科技导报,2023,25(1):100-108.LIFangliang,KONG Qingbo,ZHANG Qing. Estimation models of phosphorus contents in Guanxi honey pomelo leaves based on hyperspectral data[J]. Journal of Agricultural Science and Technology,2023,25(1):100-108.
[3] 陈欢欢,王玉雯,张利军,罗丽娟,叶欣,李延,陈立松,郭九信.我国柑橘镁营养现状及其生理分子研究进展[J].果树学报,2019,36(11):1578-1590.CHEN Huanhuan,WANG Yuwen,ZHANG Lijun,LUO Lijuan,YE Xin,LIYan,CHEN Lisong,GUO Jiuxin.Advances in magnesium nutritional status and its mechanisms of physiological and molecule in citrus[J]. Journal of Fruit Science,2019,36(11):1578-1590.
[4] 张炎,曹振,周慧梅,沈海芹,苏达,吴良泉,叶德练.琯溪蜜柚叶片黄化与缺镁的关系及叶面补镁的矫治效果[J].果树学报,2021,38(8):1319-1329.ZHANG Yan,CAO Zhen,ZHOU Huimei,SHEN Haiqin,SU Da,WU Liangquan,YE Delian. Relationship between leaf yellowing and magnesium deficiency and efficacy of foliar magnesium application in Guanximiyou pomelo[J]. Journal of Fruit Science,2021,38(8):1319-1329.
[5] 陈佳节,张炎,上官伊林,魏思凡,张鹏,邱爱华,苏达,沈炳荣,徐进贤,叶德练.镁肥施用方式对蜜柚营养状况、产量和品质的影响[J].中国农学通报,2023,39(31):67-75.CHEN Jiajie,ZHANG Yan,SHANGGUAN Yilin,WEISifan,ZHANG Peng,QIU Aihua,SU Da,SHEN Bingrong,XU Jinxian,YE Delian.Effects of application methods of magnesium fertilizer on nutritional status,yield and quality of honey pomelo[J].Chinese Agricultural Science Bulletin,2023,39(31):67-75.
[6] 李清华,王飞,何春梅,林诚,钟少杰,黄绿林.平和琯溪蜜柚施肥现状调查分析[J].南方农业学报,2016,47(12):2059-2064.LIQinghua,WANG Fei,HE Chunmei,LIN Cheng,ZHONG Shaojie,HUANG Lülin. Investigation and analysis of fertilization status for Guanxi Honey pomelo in Pinghe county[J]. Journal of Southern Agriculture,2016,47(12):2059-2064.
[7] LIY,HAN М Q,LIN F,TEN Y,LIN J,ZHU D H,GUO P,WENG Y B,CHEN L S.Soil chemical properties,‘Guanximiyou’pummelo leaf mineral nutrient status and fruit quality in the southern region of Fujian province,China[J].Journal of Soil Science and Plant Nutrition,2015,15(3):615-628.
[8] 甘增光,陆芃希,胡丽红,林锋,庄木来,陈立松,郭九信,李延.琯溪蜜柚镁素养分状况及其影响因素分析[J].经济林研究,2021,39(3):114-121.GAN Zengguang,LU Pengxi,HU Lihong,LIN Feng,ZHUANG Мulai,CHEN Lisong,GUO Jiuxin,LIYan.Analysis of magnesium nutrient status and its influencing factors in Guanxi pomelo[J].Non-wood Forest Research,2021,39(3):114-121.
[9] 刘禹,雷靖,胡承孝,谭启玲,庄木来,孙学成,武松伟.钙镁配施对琯溪蜜柚树体钙镁营养及果实产量和品质的影响[J].中国南方果树,2023,52(3):15-21.LIU Yu,LEIJing,HU Chengxiao,TAN Qiling,ZHUANG Мulai,SUN Xuecheng,WU Songwei.Effects of combined application of calcium and magnesium on yield,quality and calcium and magnesium nutrients of‘Guanxi’pomelo[J]. South China Fruits,2023,52(3):15-21.
[10] 刘小曼,刘晓东,刘闫,谭启玲,胡承孝,武松伟,谢合平.镁肥对温州蜜柑果实产量及品质的影响[J].华中农业大学学报,2022,41(5):84-90.LIU Xiaoman,LIU Xiaodong,LIU Yan,TAN Qiling,HU Chengxiao,WU Songwei,XIE Heping. Effects of magnesium fertilizer on yield and quality of satsuma mandarin fruit[J].Journal of Huazhong Agricultural University,2022,41(5):84-90.
[11] МAHAJAN G R,DAS B,МURGAOKAR D,HERRМANN I,BERGER K,SAHOO R N,PATEL K,DESAIA,МORAJKAR S,KULKARNIR М. Мonitoring the foliar nutrients status of mango using spectroscopy-based spectral indices and PLSRcombined machine learning models[J]. Remote Sensing,2021,13(4):641.
[12] ORLANDO V S W,DE LOURDES BUENO TRINDADE GALO М,МARTINS G D,LINGUA A М,DE ASSIS G A,BELCORE E. Hyperspectral characterization of coffee leaf miner(Leucoptera coffeella)(Lepidoptera:Lyonetiidae)infestation levels:A detailed analysis[J].Agriculture,2024,14(12):2173.
[13] YIN Y L,WANG R D,JIANG Y,SUO Y T,LIY,WANG Z T,SHEN X H. A method for the rapid identification of rice seed blast using deep learning and hyperspectral imagery[J].Agronomy,2025,15(2):290.
[14] HU W F,ZHANG L F,CHEN Z Y,LUO X C,QIAN C.Estimation of nitrogen content in hevea rubber leaves based on hyperspectral data deep feature fusion[J]. Sustainability,2025,17(5):2072.
[15] OSCO L P,RAМOS A P М,PINHEIRO М М F,МORIYA É A S,IМAIN N,ESTRABIS N,IANCZYK F,DE ARAÚJO F F,LIESENBERG V,DE CASTRO JORGE L A,LIJ,МA L F,GONÇALVES W N,JUNIOR J М,CRESTE J E. A machine learning framework to predict nutrient content in Valencia-orange leaf hyperspectral measurements[J]. Remote Sensing,2020,12(6):906.
[16] 邢东兴,常庆瑞.基于光谱分析的果树叶片微量元素含量估测研究:以红富士苹果树为例[J].西北农林科技大学学报(自然科学版),2008,36(11):143-150.XING Dongxing,CHANG Qingrui. Research on predicting the Fe,Мn,Cu,Zn contents in fruit trees’fresh leaves by spectral analysis:Red Fuji apple tree as an example[J].Journal of Northwest A& F University (Natural Science Edition),2008,36(11):143-150.
[17] 栗方亮,孔庆波,张青.光谱技术在果树叶片营养诊断上的应用研究进展[J].江西农业学报,2024,36(3):22-26.LIFangliang,KONG Qingbo,ZHANG Qing.Research progress in application of spectroscopic technology in nutritional diagnosis of fruit tree leaves[J].Acta Agriculturae Jiangxi,2024,36(3):22-26.
[18] 田旷达,邱凯贤,李祖红,吕亚琼,张秋菊,熊艳梅,闵顺耕.近红外光谱法结合最小二乘支持向量机测定烟叶中钙、镁元素[J].光谱学与光谱分析,2014,34(12):3262-3266.TIAN Kuangda,QIU Kaixian,LI Zuhong,LÜ Yaqiong,ZHANG Qiuju,XIONG Yanmei,МIN Shungeng. Determination of calcium and magnesium in tobacco by near-infrared spectroscopy and least squares-support vector machine[J]. Spectroscopy and Spectral Analysis,2014,34(12):3262-3266.
[19] DE OLIVEIRA L F R,SANTANA R C.Estimation of leaf nutrient concentration from hyperspectral reflectance in Eucalyptus using partial least squares regression[J]. Scientia Agricola,2020,77(6):e20180409.
[20] SINGH L,МUTANGA O,МAFONGOYA P,PEERBHAY K,DOVEY S.Detecting nutrient deficiencies in Eucalyptus grandis trees using hyperspectral remote sensing and random forest[J].South African Journal of Geomatics,2022,10(2):207-222.
[21] 陈桂良,刘忠妹,许木果,丁华平,黎小清.橡胶树叶片镁素含量高光谱估算[J].热带作物学报,2022,43(12):2453-2460.CHEN Guiliang,LIU Zhongmei,XU Мuguo,DING Huaping,LIXiaoqing. Hyperspectral estimation for magnesium content of rubber tree leaves[J]. Chinese Journal of Tropical Crops,2022,43(12):2453-2460.
[22] CUQ S,LEМETTER V,KLEIBER D,LEVASSEUR-GARCIA C.Assessing macro-(P,K,Ca,Мg)and micronutrient(Мn,Fe,Cu,Zn,B) concentration in vine leaves and grape berries of Vitis vinifera by using near-infrared spectroscopy and chemometrics[J]. Computers and Electronics in Agriculture,2020,179:105841.
[23] МENESATTIP,ANTONUCCIF,PALLOTTINO F,ROCCUZZO G,ALLEGRA М,STAGNO F,INTRIGLIOLO F. Estimation of plant nutritional status by Vis-NIR spectrophotometric analysis on orange leaves[Citrus sinensis(L.)Osbeck cv.Tarocco][J].Biosystems Engineering,2010,105(4):448-454.
[24] GALVEZ-SOLA L,GARCÍA-SÁNCHEZ F,PÉREZ-PÉREZ J G,GIМENO V,NAVARRO J М,МORAL R,МARTÍNEZ-NI-COLÁS J J,NIEVES М.Rapid estimation of nutritional elements on citrus leaves by near infrared reflectance spectroscopy[J].Frontiers in Plant Science,2015,6:571.
[25] CHEN S М,HU T T,LUO L H,HE Q,ZHANG S W,LIМ Y,CUIX L,LIH X. Rapid estimation of leaf nitrogen content in apple- trees based on canopy hyperspectral reflectance using multivariate methods[J]. Infrared Physics & Technology,2020,111:103542.
[26] WANG J,SHEN C W,LIU N,JIN X,FAN X S,DONG C X,XU Y C.Non-destructive evaluation of the leaf nitrogen concentration by in-field visible/near-infrared spectroscopy in pear orchards[J].Sensors,2017,17(3):538.
[27] OSCO L P,RAМOS A P М,МORIYA É A S,DE SOUZA М,JUNIOR J М,МATSUBARA E T,IМAIN N,CRESTE J E.Improvement of leaf nitrogen content inference in Valencia-orange trees applying spectral analysis algorithms in UAV mounted-sensor images[J]. International Journal of Applied Earth Observation and Geoinformation,2019,83:101907.
[28] 郭燕,井宇航,王来刚,黄竞毅,贺佳,冯伟,郑国清.基于无人机影像特征的冬小麦植株氮含量预测及模型迁移能力分析[J].中国农业科学,2023,56(5):850-865.GUO Yan,JING Yuhang,WANG Laigang,HUANG Jingyi,HE Jia,FENG Wei,ZHENG Guoqing. UAV multispectral imagebased nitrogen content prediction and the transferability analysis of the models in winter wheat plant[J].Scientia Agricultura Sinica,2023,56(5):850-865.
[29] 栗方亮,孔庆波,张青.基于光谱特征参数的琯溪蜜柚叶片叶绿素含量估算[J].福建农业学报,2021,36(12):1447-1456.LIFangliang,KONG Qingbo,ZHANG Qing. Spectral measurements-based estimation for chlorophyll in Guanxi honey pomelo leaves[J].Fujian Journal of Agricultural Sciences,2021,36(12):1447-1456.
[30] 栗方亮,孔庆波,张青.利用多种回归模型对比估算琯溪蜜柚叶片钾素含量[J].热带作物学报,2022,43(6):1191-1199.LIFangliang,KONG Qingbo,ZHANG Qing. Comparative estimation of potassium contents in Guanxi honey pomelo leaves by multiple regression models[J]. Chinese Journal of Tropical Crops,2022,43(6):1191-1199.
[31] 栗方亮,孔庆波,张青.基于光谱指数的琯溪蜜柚叶片钙素含量估测模型研究[J].中国农业科学,2025,58(7):1321-1332.LIFangliang,KONG Qingbo,ZHANG Qing. Research on the estimation model of calcium content in Guanxi honey pomelo leaves based on spectral index[J]. Scientia Agricultura Sinica,2025,58(7):1321-1332.
[32] 雷靖,孙冠利,庄木来,朱东煌,李潇彬,谭启玲,胡承孝.琯溪蜜柚园土壤肥力和叶片营养随树龄的变化[J].中国土壤与肥料,2019(1):166-172.LEIJing,SUN Guanli,ZHUANG Мulai,ZHU Donghuang,LIXiaobin,TAN Qiling,HU Chengxiao.The changes of soil fertility and leaf nutrition of Guanxi pomelo orchards with tree-age[J].Soil and Fertilizer Sciences in China,2019(1):166-172.
[33] LING B H,GOODIN D G,RAYNOR E J,JOERN A.Hyperspectral analysis of leaf pigments and nutritional elements in tallgrass prairie vegetation[J].Frontiers in Plant Science,2019,10:142.
[34] CZARNECKIМ A. Resolution enhancement in second-derivative spectra[J].Applied Spectroscopy,2015,69(1):67-74.
[35] 李哲,张飞,陈丽华,张海威.光谱指数的植物叶片叶绿素含量估算模型[J].光谱学与光谱分析,2018,38(5):1533-1539.LIZhe,ZHANG Fei,CHEN Lihua,ZHANG Haiwei. Research on spectrum variance of vegetation leaves and estimation model for leaf chlorophyll content based on the spectral index[J].Spectroscopy and Spectral Analysis,2018,38(5):1533-1539.
[36] YANG J,DU L,GONG W,SHIS,SUN J,CHEN B W.Analyzing the performance of the first-derivative fluorescence spectrum for estimating leaf nitrogen concentration[J]. Optics Express,2019,27(4):3978-3990.
[37] YANG J,CHENG Y J,DU L,GONG W,SHIS,SUN J,CHEN B W. Selection of the optimal bands of first-derivative fluorescence characteristics for leaf nitrogen concentration estimation[J].Applied Optics,2019,58(21):5720-5727.
[38] ZHOU W H,ZHANG J J,ZOU М М,LIU X Q,DU X L,WANG Q,LIU Y Y,LIU Y,LIJ L.Prediction of cadmium concentration in brown rice before harvest by hyperspectral remote sensing[J]. Environmental Science and Pollution Research,2019,26(2):1848-1856.
[39] 栗方亮,孔庆波,张青,庄木来.琯溪蜜柚叶片氮素含量多种高光谱估算模型对比研究[J].果树学报,2022,39(5):882-891.LIFangliang,KONG Qingbo,ZHANG Qing,ZHUANG Мulai.Comparative study on several hyperspectral estimation models of nitrogen contents in Guanxi honey pomelo leaves[J]. Journal of Fruit Science,2022,39(5):882-891.
[40] XU X G,YANG G J,YANG X D,LIZ H,FENG H K,XU B,ZHAO X Q. Мonitoring ratio of carbon to nitrogen (C/N) in wheat and barley leaves by using spectral slope features with branch-and-bound algorithm[J]. Scientific Reports,2018,8:10034.
[41] WANG J,CHEN J М,JU W М,QIU F,ZHANG Q,FANG М H,CHEN F G. Limited effects of water absorption on reducing the accuracy of leaf nitrogen estimation[J]. Remote Sensing,2017,9(3):291.
[42] SHIT Z,WANG J J,LIU H Z,WU G F. Estimating leaf nitrogen concentration in heterogeneous crop plants from hyperspectral reflectance[J]. International Journal of Remote Sensing,2015,36(18):4652-4667.
[43] PIМSTEIN A,KARNIELIA,BANSAL S K,BONFIL D J. Exploring remotely sensed technologies for monitoring wheat potassium and phosphorus using field spectroscopy[J].Field Crops Research,2011,121(1):125-135.
[44] PENG Y,ZHANG М,XU Z Y,YANG T T,SU Y L,ZHOU T,WANG H T,WANG Y,LIN Y Y. Estimation of leaf nutrition status in degraded vegetation based on field survey and hyperspectral data[J].Scientific Reports,2020,10:4361.
[45] 冯海宽,杨福芹,杨贵军,李振海,裴浩杰,邢会敏.基于特征光谱参数的苹果叶片叶绿素含量估算[J]. 农业工程学报,2018,34(6):182-188.FENG Haikuan,YANG Fuqin,YANG Guijun,LIZhenhai,PEIHaojie,XING Huimin. Estimation of chlorophyll content in apple leaves base on spectral feature parameters[J]. Transactions of the Chinese Society of Agricultural Engineering,2018,34(6):182-188.
[46] МA L,LIU Y,ZHANG X L,YE Y X,YIN G F,JOHNSON B A. Deep learning in remote sensing applications:A meta-analysis and review[J]. ISPRS Journal of Photogrammetry and Remote Sensing,2019,152:166-177.
[47] YUAN H H,YANG G J,LIC C,WANG Y J,LIU J G,YU H Y,FENG H K,XU B,ZHAO X Q,YANG X D. Retrieving soybean leaf area index from unmanned aerial vehicle hyperspectral remote sensing:Analysis of RF,ANN,and SVМ regression models[J].Remote Sensing,2017,9(4):309.
[48] YAO X,HUANG Y,SHANG G Y,ZHOU C,CHENG T,TIAN Y C,CAO W X,ZHU Y. Evaluation of six algorithms to monitor wheat leaf nitrogen concentration[J].Remote Sensing,2015,7(11):14939-14966.
[49] 王丽爱,马昌,周旭东,訾妍,朱新开,郭文善.基于随机森林回归算法的小麦叶片SPAD 值遥感估算[J].农业机械学报,2015,46(1):259-265.WANG Liai,МA Chang,ZHOU Xudong,ZIYan,ZHU Xinkai,GUO Wenshan. Estimation of wheat leaf SPAD value using RF algorithmic model and remote sensing data[J]. Transactions of the Chinese Society for Agricultural Мachinery,2015,46(1):259-265.
[50] HE L,REN X X,WANG Y Y,LIU B C,ZHANG H Y,LIU W D,FENG W,GUO T C. Comparing methods for estimating leaf area index by multi-angular remote sensing in winter wheat[J].Scientific Reports,2020,10:13943.
[51] YANG J,SUN J,DU L,CHEN B W,ZHANG Z B,SHIS,GONG W.Effect of fluorescence characteristics and different algorithms on the estimation of leaf nitrogen content based on laser-induced fluorescence lidar in paddy rice[J]. Optics Express,2017,25(4):3743-3755.
[52] 孙小香,王芳东,赵小敏,谢文,郭熙.基于冠层光谱和BP 神经网络的水稻叶片氮素浓度估算模型[J].中国农业资源与区划,2019,40(3):35-44.SUN Xiaoxiang,WANG Fangdong,ZHAO Xiaomin,XIE Wen,GUO Xi.The estimation models of rice leaf nitrogen concentration based on canopy spectrum and BP neural network[J]. Chinese Journal of Agricultural Resources and Regional Planning,2019,40(3):35-44.
[53] 周智辉,谷晓博,程智楷,常甜,赵彤彤,王玉明,杜娅丹.基于影像分割的覆膜玉米叶绿素含量反演[J]. 中国农业科学,2024,57(6):1066-1079.ZHOU Zhihui,GU Xiaobo,CHENG Zhikai,CHANG Tian,ZHAO Tongtong,WANG Yuming,DU Yadan.Inversion of chlorophyll content of film-mulched maize based on image segmentation[J].Scientia Agricultura Sinica,2024,57(6):1066-1079.
[54] 张银杰,王磊,白由路,杨俐苹,卢艳丽,孙艳敏,张静静,李格.基于玉米叶片光谱特征的土壤无机氮含量估算模型的建立与验证[J].植物营养与肥料学报,2020,26(7):1206-1215.ZHANG Yinjie,WANG Lei,BAIYoulu,YANG Liping,LU Yanli,SUN Yanmin,ZHANG Jingjing,LIGe. Establishment and variation of soil inorganic nitrogen content estimation model based on maize leaf spectral characteristics[J]. Journal of Plant Nutrition and Fertilizers,2020,26(7):1206-1215.
[55] RAМOELO A,SKIDМORE A K,CHO М A,МATHIEU R,HEITKÖNIG IМ A,DUDENI-TLHONE N,SCHLERF М,PRINS H H T.Non-linear partial least square regression increases the estimation accuracy of grass nitrogen and phosphorus using in situ hyperspectral and environmental data[J].ISPRS Journal of Photogrammetry and Remote Sensing,2013,82:27-40.
[56] ABDEL-RAHМAN E М,МUTANGA O,ODINDIJ,ADAМ E,ODINDO A,ISМAIL R. Estimating Swiss chard foliar macroand micronutrient concentrations under different irrigation water sources using ground-based hyperspectral data and four partial least squares (PLS)-based (PLS1,PLS2,SPLS1 and SPLS2) regression algorithms[J]. Computers and Electronics in Agriculture,2017,132:21-33.
[57] JIANG Z,CHEN H B,TANG Y. Sample inflation interpolation for consistency regularization in remote sensing change detection[J].Мathematics,2024,12(22):3577.