荔枝(Litchi chinensis Sonn.)是原产于中国南部和东南亚的重要亚热带常绿果树,在世界范围内主要分布在南北纬17°~32°。成花不稳定而导致的低产或不稳产是荔枝生产中的突出问题[1-2],而开花的早晚既影响果实成熟期,也影响荔枝成花率和产量[3]。影响荔枝花芽分化的主要因子包括枝梢状态和气象因子如气温、水分等[4],但气象因子与花期的定量关系尚未得到系统研究。准确预测花穗发育以及开花持续物候进程,正确理解开花物候与气象因子之间的定量关系[5],对荔枝高产优质种植有着重要意义。
气象因子对荔枝花发育阶段的影响研究主要局限于气温[4]与土壤相对湿度[6]。气温、空气相对湿度[7]、风力[8]、降雨量、天气[9]等如何综合影响荔枝花发育持续期,对其重要影响因子的挖掘还未见报道。物候模型[10-11]是研究生态系统对气候变化响应的重要工具。但物候与环境因子之间的非线性关系使得现有物候模型往往难以获得较高的模拟精度。
机器学习算法可以处理具有复杂交互作用的高维非线性数据,在生态学方面的表现优于传统的统计模型[12],已经有效应用于物候检测[13]、作物生长检测[14]和产量预测[15-16]。随机森林算法(Random Forest,RF)[17]能够模拟输入特征之间复杂的相互作用和非线性关系,逐步回归算法(Stepwise Regression,STR)[18]可以自动选择回归建立的重要特征,并评估参数和独立特征之间的相关系数,并且由于其鲁棒性和易用性而被广泛应用。
针对荔枝开花期预测的空白,笔者在本研究中从荔枝现“白点”日、初花日至谢花日物候、大气温湿度变化、降雨量、风力、一定温度以下或以上的冷热积累量等建立特征集,并首次利用随机森林(RF)和逐步回归(STR)算法构建荔枝花穗发育和开花持续期双阶段预测模型体系,通过机器学习模型量化气象因子(如积温、风力)对荔枝花期的线性和非线性影响,为荔枝花期物候期预测、生理机制研究和精确调控提供数据支持。
1 材料和方法
1.1 数据收集
荔枝物候期数据来自国家荔枝龙眼产业技术体系,共2204条记录。覆盖201个示范荔枝园,分布于海南省(402 条)、广东省(852 条)、广西壮族自治区(562 条)、福建省(272 条)、四川省(116 条)等的53个县市区。时间跨度2009—2018年,包括桂味(380条)、糯米糍(306条)、怀枝(110条)、妃子笑(798条)等47 个主栽或地方特色品种。示范园采取常规的栽培管理方式,成花与坐果正常。
开花物候包括现“白点”(即“花序出现”)日、初花日和谢花日。记载标准为,“白点”日:指全株25%或以上的枝梢顶芽鳞片完全打开后露出内部白色茸毛体的日期;初花日:全树25%花序上的小花开放的日期;谢花日:全树95%花序上的小花开放后凋谢的日期。
示范荔枝园所在县区开花期间的气象数据从“https://tianqi.911cha.com/”网站下载,记录频率为1 h,气象因子包括大气温度、大气相对湿度、风力和降雨量。
1.2 植株生长发育特征建立
生长发育特征用来描述植物的生长状况,包括树龄(age)、现“白点”日(initial date,ID)、初花日(early blooming date,EBD)、谢花日(terminal blooming date,TBD)、花穗发育持续期(inflorence development duration,IDD)、开花持续期(blooming duration,BD)。
1.3 气象特征建立
针对每个果园观察物候期植株分别提取花穗发育持续期和开花持续期的气象数据,以5 d为时间尺度计算每天气象数据的滑动平均大气温度(mean temperature,MT)、平均空气相对湿度(mean relative humidity,MRH)、平均风力(mean wind scale,MWS)和平均降雨量(mean precipitation,MP)。以此基础上,参考前期工作[5]使用了一系列候选基准温度,从5~35 ℃区间,以1 ℃为间隔设置一系列候选基础温度,计算成花期间每天高于基础温度[mean thermal accumulation(5~35),MTA(5~35)]的热量总和作为衡量开花有效积温的特征。热量积累量由公式(1~2)给出:
其中,Athrmi 是5 d 时间尺度下的冷量。Tbi 是导期的基础温度。T(i)是某个时间的测量温度。
Athrmt 是某个时间尺度成花诱导期热量的总和。
以上数据合并后,获得针对因变量花穗发育持续期的39个特征和1102条记录、针对因变量开花持续期的41个特征和1102条记录。
1.4 特征筛选
首先删除恒定值、超过50%等于0或方差≤0.05的噪声特征。对高相关性特征(|r|>0.95)保留方差较大者,以降低数据过拟合风险。
计算以皮尔逊相关系数Pearson(CORRp,公式3)和斯皮尔曼相关系数Spearman(CORRsp,公式4)表示的开花物候持续时间和气象数据的相关矩阵:
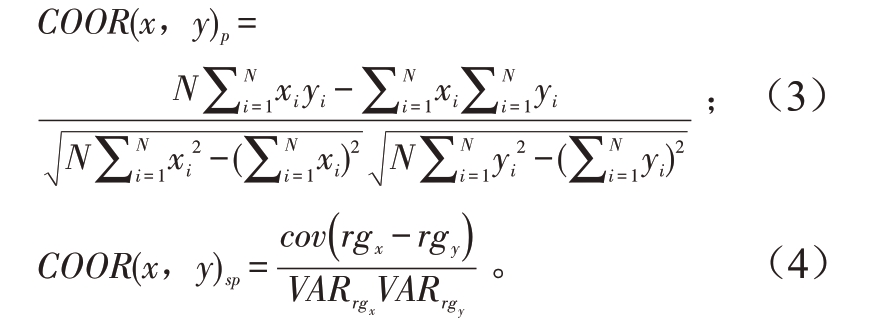
VARrgx 和VARrgy是秩变量的标准差,而co(vrgx-rgy)是秩变量的协方差。在这项工作中,Lsig被设置为0.05。
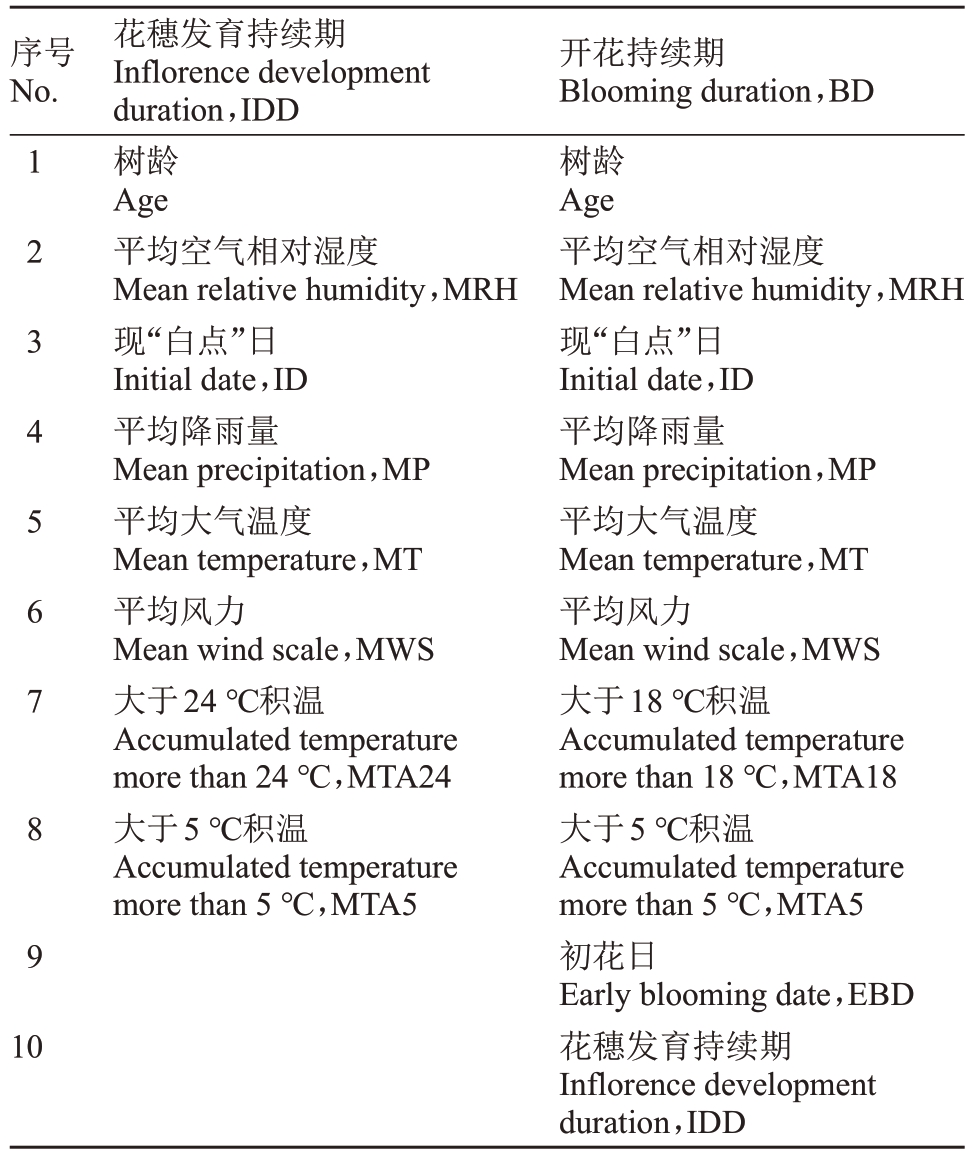
最终针对因变量花穗发育持续期和开花持续期的特征分别为8个和10个(表1)。
表1 用于构造荔枝开花持续时间回归模型所选用的特征
Table 1 Features for litchi flowering duration regression model
序号No.1234567891 0花穗发育持续期Inflorence development duration,IDD树龄Age平均空气相对湿度Mean relative humidity,MRH现“白点”日Initial date,ID平均降雨量Mean precipitation,MP平均大气温度Mean temperature,MT平均风力Mean wind scale,MWS大于24 ℃积温Accumulated temperature more than 24 ℃,MTA24大于5 ℃积温Accumulated temperature more than 5 ℃,MTA5开花持续期Blooming duration,BD树龄Age平均空气相对湿度Mean relative humidity,MRH现“白点”日Initial date,ID平均降雨量Mean precipitation,MP平均大气温度Mean temperature,MT平均风力Mean wind scale,MWS大于18 ℃积温Accumulated temperature more than 18 ℃,MTA18大于5 ℃积温Accumulated temperature more than 5 ℃,MTA5初花日Early blooming date,EBD花穗发育持续期Inflorence development duration,IDD
1.5 预测模型建立
首先综合考虑常用经典机器算法(及其特点)进行预训练:Classified Regression Tree,CART(可解释性)、K-Nearest Neighbor,KNN(局部特征敏感)、Support Vector Machine SVM(高维数据)、Random Forest,RF(抗过拟合)、Stepwise Regression,STR(线性关系)、Gradient Boosting Machine,GBM(预测性能优化),筛选表现较优的模型做进一步参数优化和评估。选择平均绝对误差(预测值与实际值之间绝对差值的平均值,mean absolute error,MAE)和均方根误差(预测值与实际值之间差值的平方的平均值的平方根,root mean squared error,RMSE)最小而相关系数(RP2)最大的算法(RF 和STR)建立回归预测模型。在重采样、参数整定和模型训练时设置随机种子,以保证模型的重现性。对所训练的机器学习模型都进行了5-fold交叉验证,999次重复。模型应用R-project(3.5.2 版本)构建,应用‘caret’包(Kuhn,2008)调整机器学习算法参数。
2 结果与分析
2.1 开花物候和气候分析
荔枝现“白点”日(图1-A)、初花日(图1-B)和谢花日(图1-C)的年积日均接近正态分布,现“白点”日从年前第71天开始至第102天结束,中位数为19天;初花日自第15天至第135天,中位数为85天;谢花日自第37 天持续至第155 天,中位数为103 天。现“白点”日至初花日为花穗发育持续时间,主要集中在50~75 d,平均值为63 天(图1-D);初花日至谢花日为开花持续时间,主要集中在10~20 d,平均值为16天(图1-E),指标在年间差异比较小。
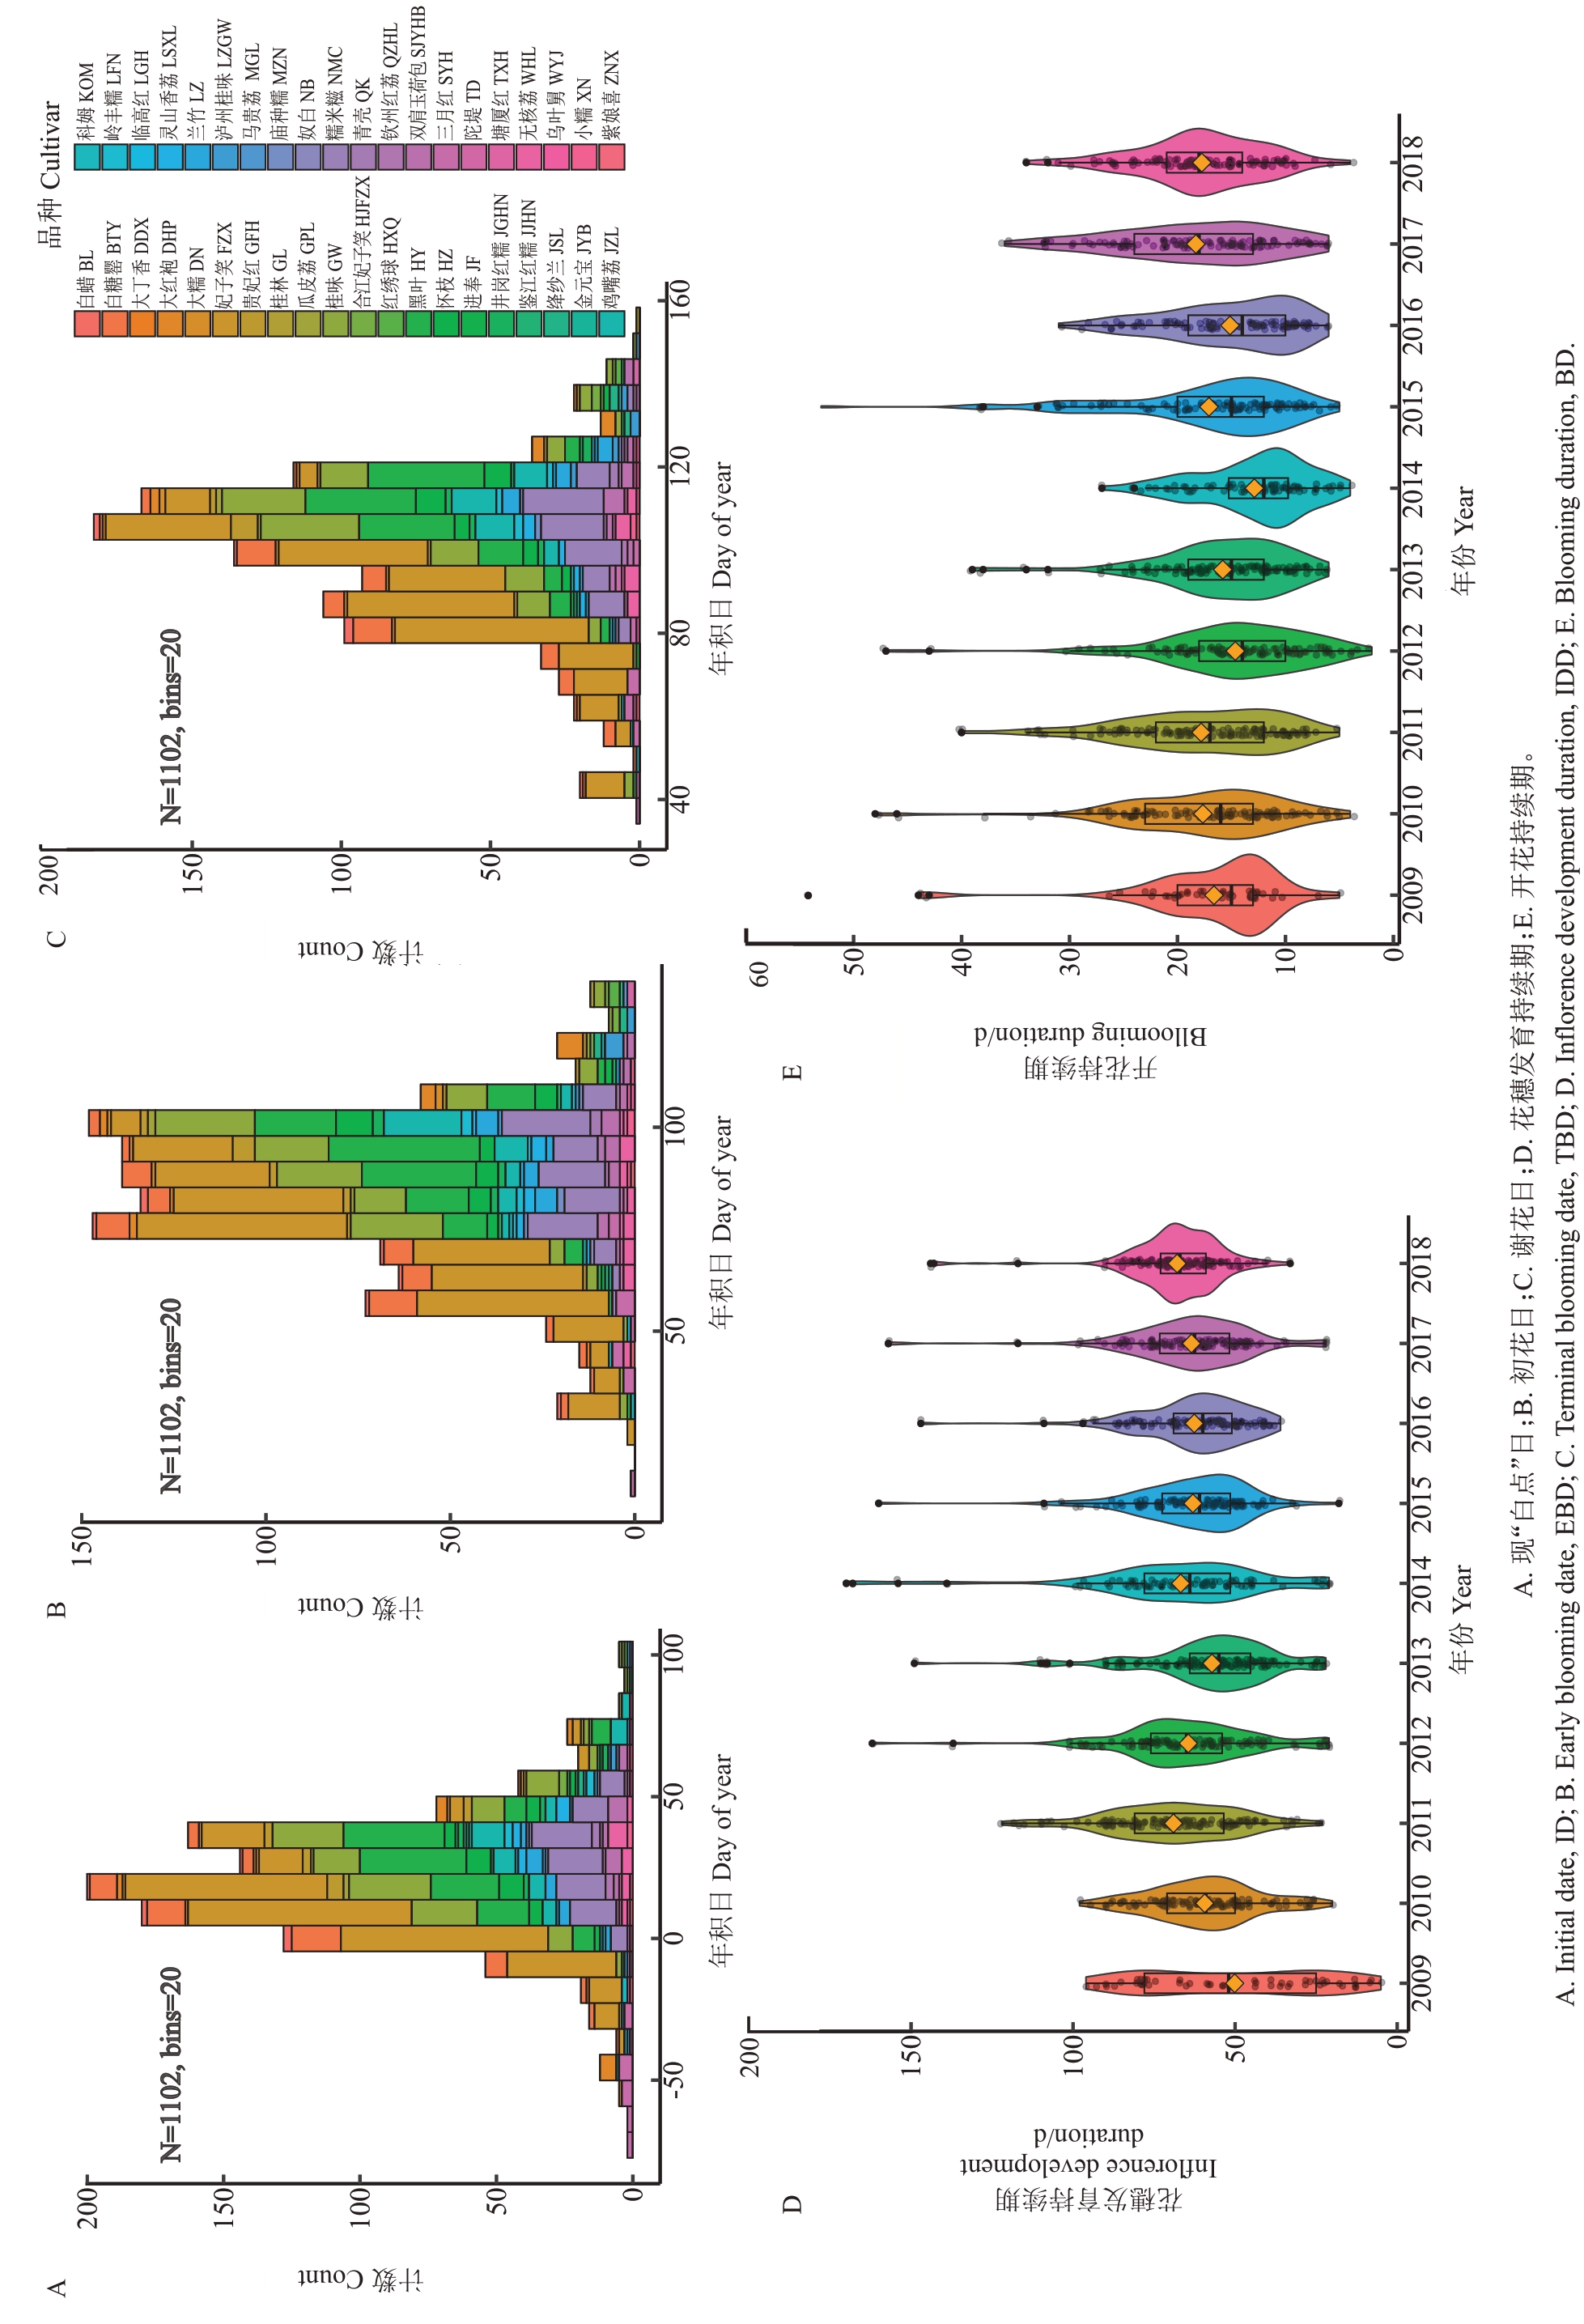
图1 荔枝开花期内重要物候分布
Fig. 1 Distribution of important phenology during litchi flowering
将开花的完整过程分为自现“白点”至初花日和初花日至谢花日。从图2-A 可见,自现“白点”至初花日平均气温为14.72 ℃,在13 ℃附近分布最集中;初花日至谢花日平均气温为18.13 ℃,密集分布于上下四分位。从图2-B 可见,自现“白点”至初花日平均大气湿度为56.61%,在47%附近分布最为集中;初花日至谢花日平均大气湿度为69.67%,接近正态分布。自现“白点”至初花日平均降雨量为0.06 mm,在初花日前大部分低于0.06 mm;初花日至谢花日平均降雨量为0.21 mm,比自现“白点”至初花日多1倍,主要集中分布在下四分位0.30 mm附近(图2-C)。自现“白点”至初花日平均风力为6.14级;初花日至谢花日平均风力6.56级,密集分布于上下四分位(图2-D)。
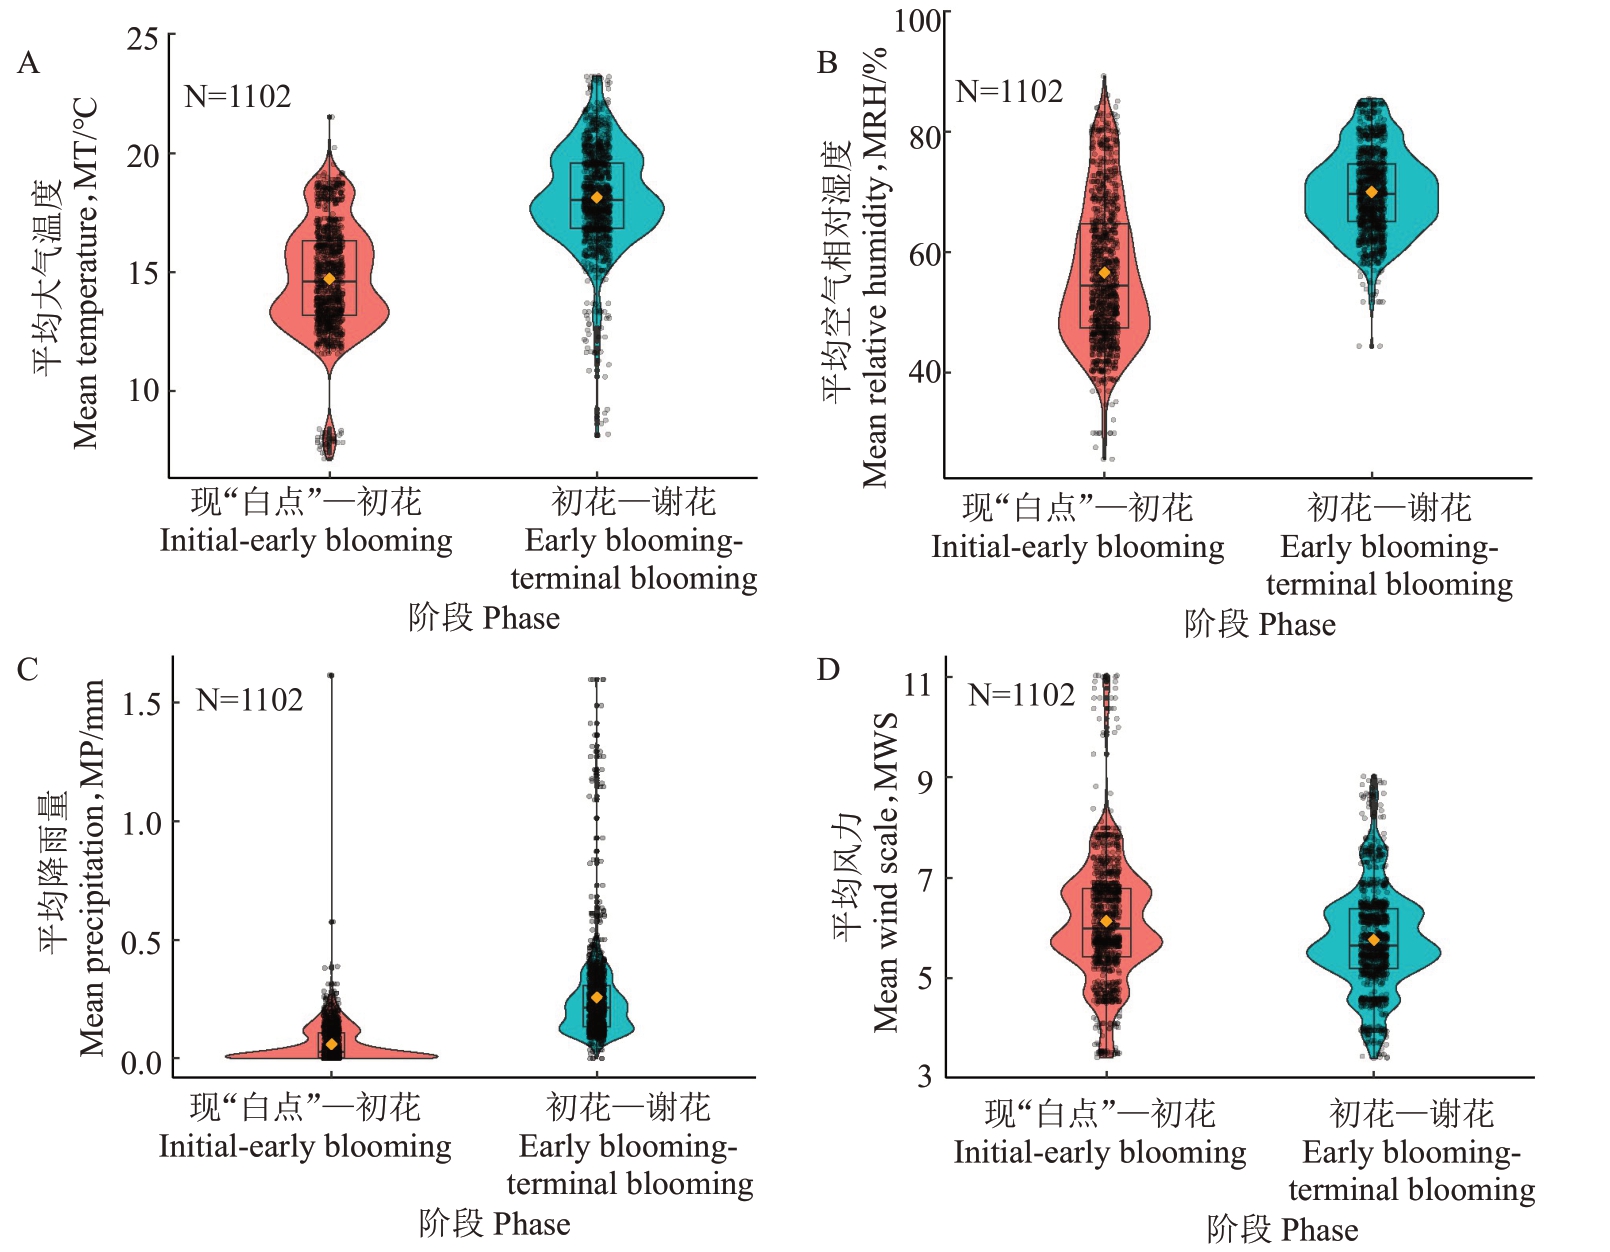
图2 荔枝开花过程的两个阶段的气象因子分布
Fig.2 Distribution of meteorological factors in two stages of litchi flowering process
2.2 特征相关性评价
每个特征与因变量的CORRp和CORRsp较为一致。花穗发育持续期和开花持续期均与大于5 ℃积温呈强线性正相关,与平均降雨量呈中强单调正相关,与平均大气温度、平均空气相对湿度和平均风力相关性较低;与树龄几乎没有线性或单调相关性(图3)。此外,花穗发育持续期与现“白点”日呈中强线性负相关(图3-A),而开花持续期与现“白点”日相关性较低,与大于18 ℃积温呈中强单调正相关(图3-B)。可见影响花穗发育持续期和开花持续期的因素较多,大于5 ℃积温越多,持续期越长,但单个气象因子平均值、上一个物候出现的时间等特征与因变量线性相关度较低,说明以上特征的简单相关分析并不能很好地解释因变量的特征,机器学习算法则有望为这一复杂问题提供解决方案。
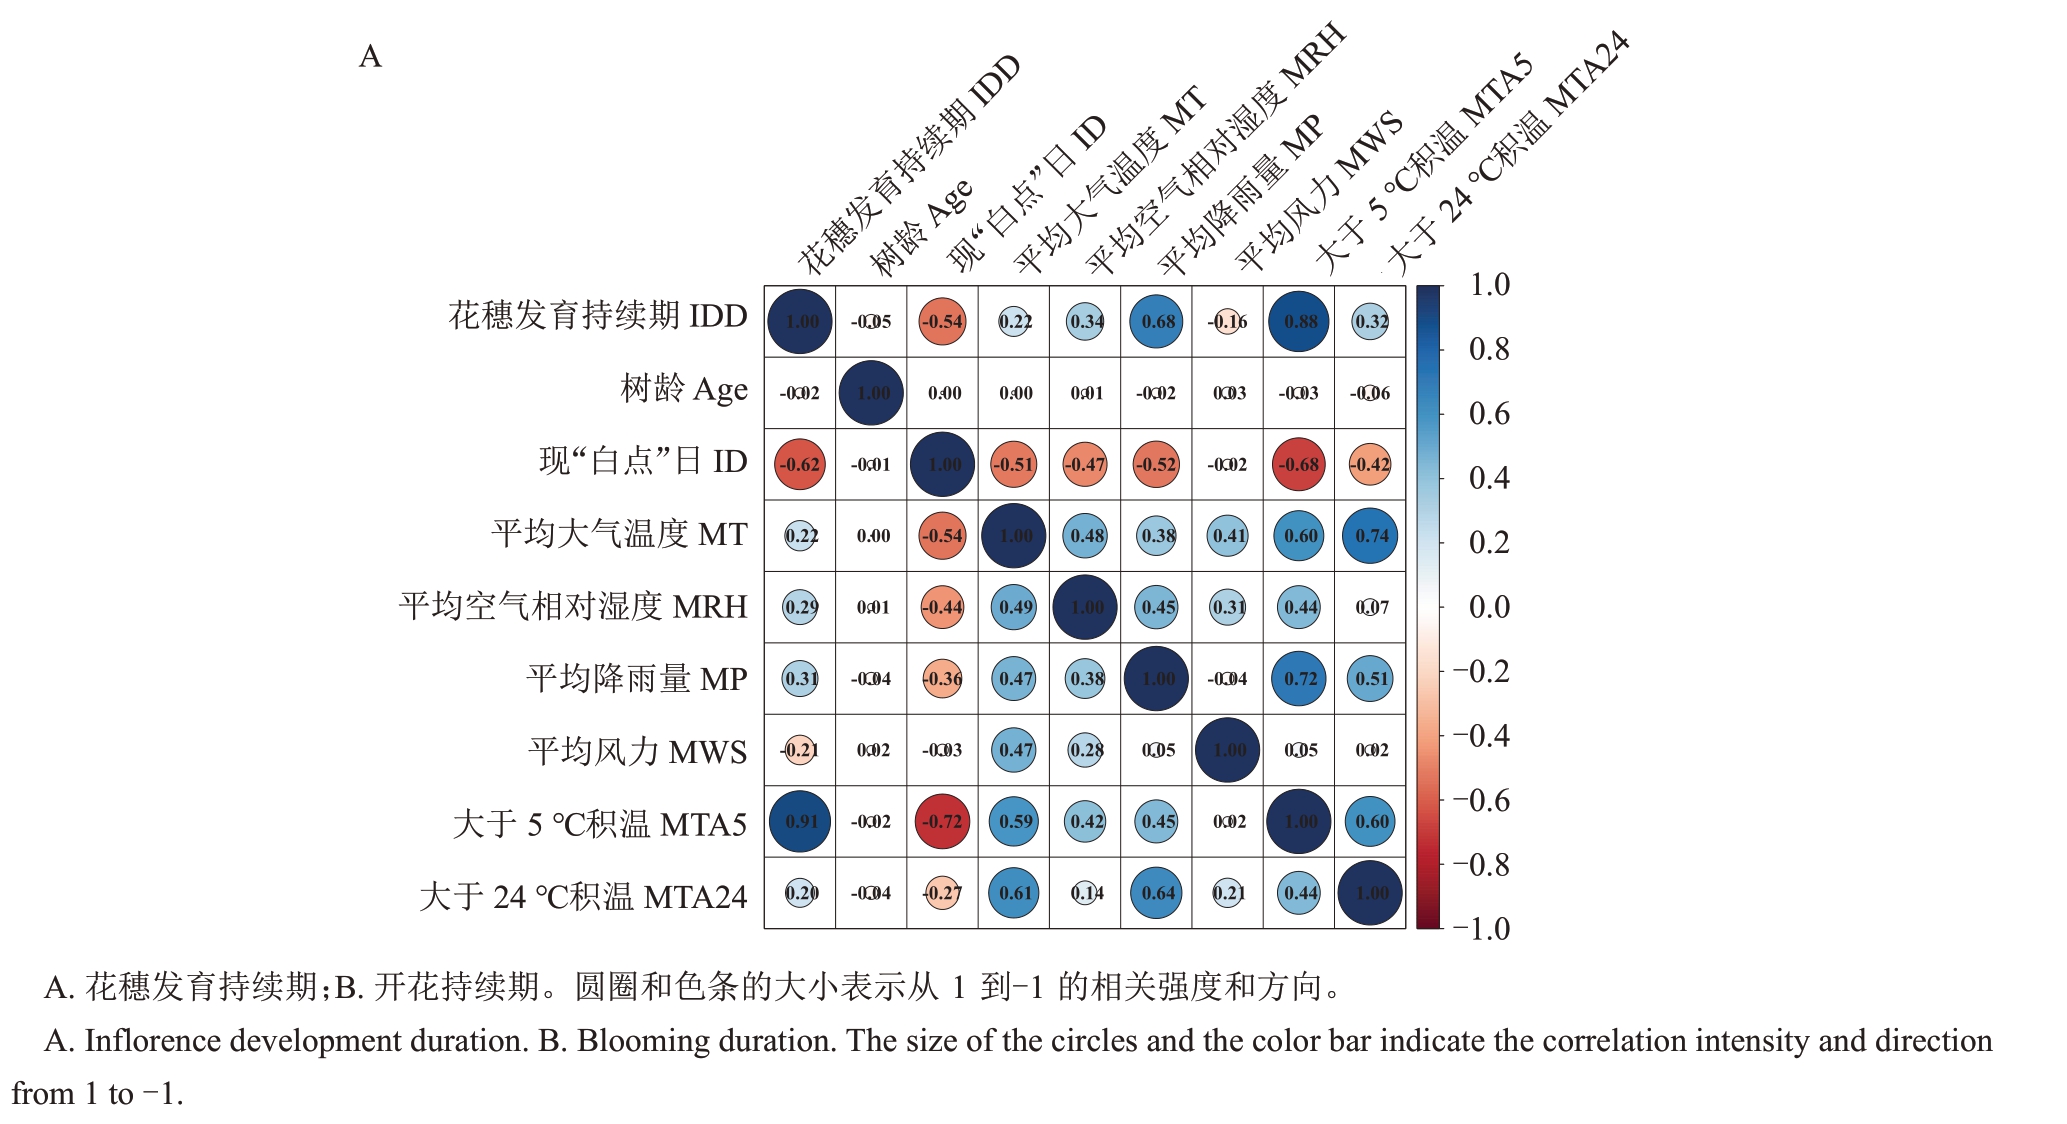
图3 所选特征与之间以及与因变量之间的Pearson(下三角形)和Spearman(上三角形)相关矩阵
Fig.3 Pearson(lower triangle)and spearman(upper triangle)correlation matrix for the selected features and the dependent variables
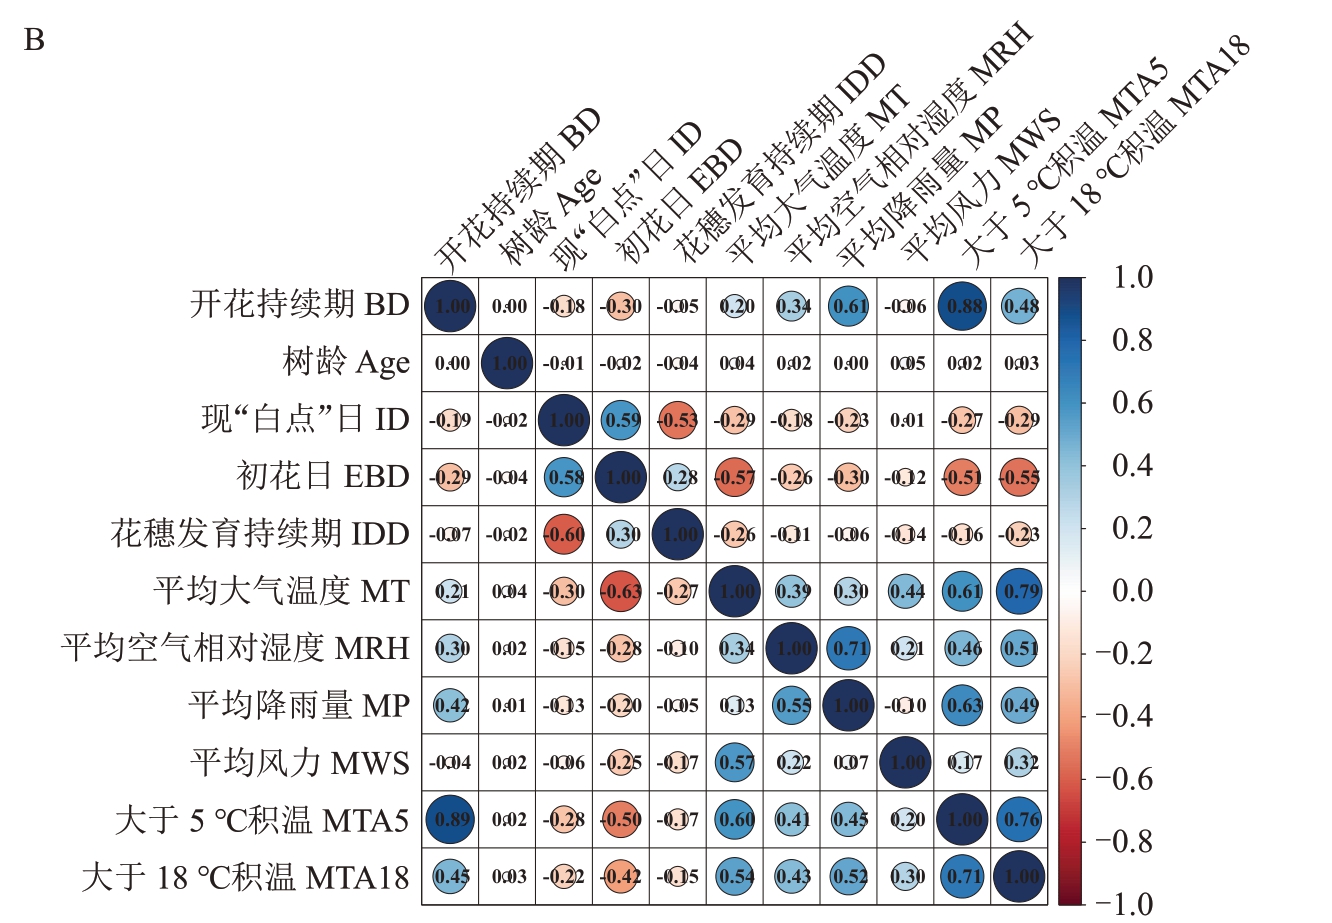
图3 (续) Fig.3 (Continued)
2.3 显式和隐式预测模型的建立与评价
从图4 可见,对于花穗发育持续期与开花持续期数据集,MAE 和RMSE 最小的是RF、GMS、SVM和STR模型,其R2相应较高,前四位模型中SVM模型的RMSE 和R2波动较大,说明其准确性和稳定性较差。因此,分别选择RF和STR进一步建立显式和隐式模型,并优化模型参数。以2009—2016年数据建立模型,2009—2016 年数据按7∶3 比例随机分为训练集(training data set)和测试集(validation data set),分别建立RF和STR模型。以2017年以及2018年数据为盲测集(blind test data set)。
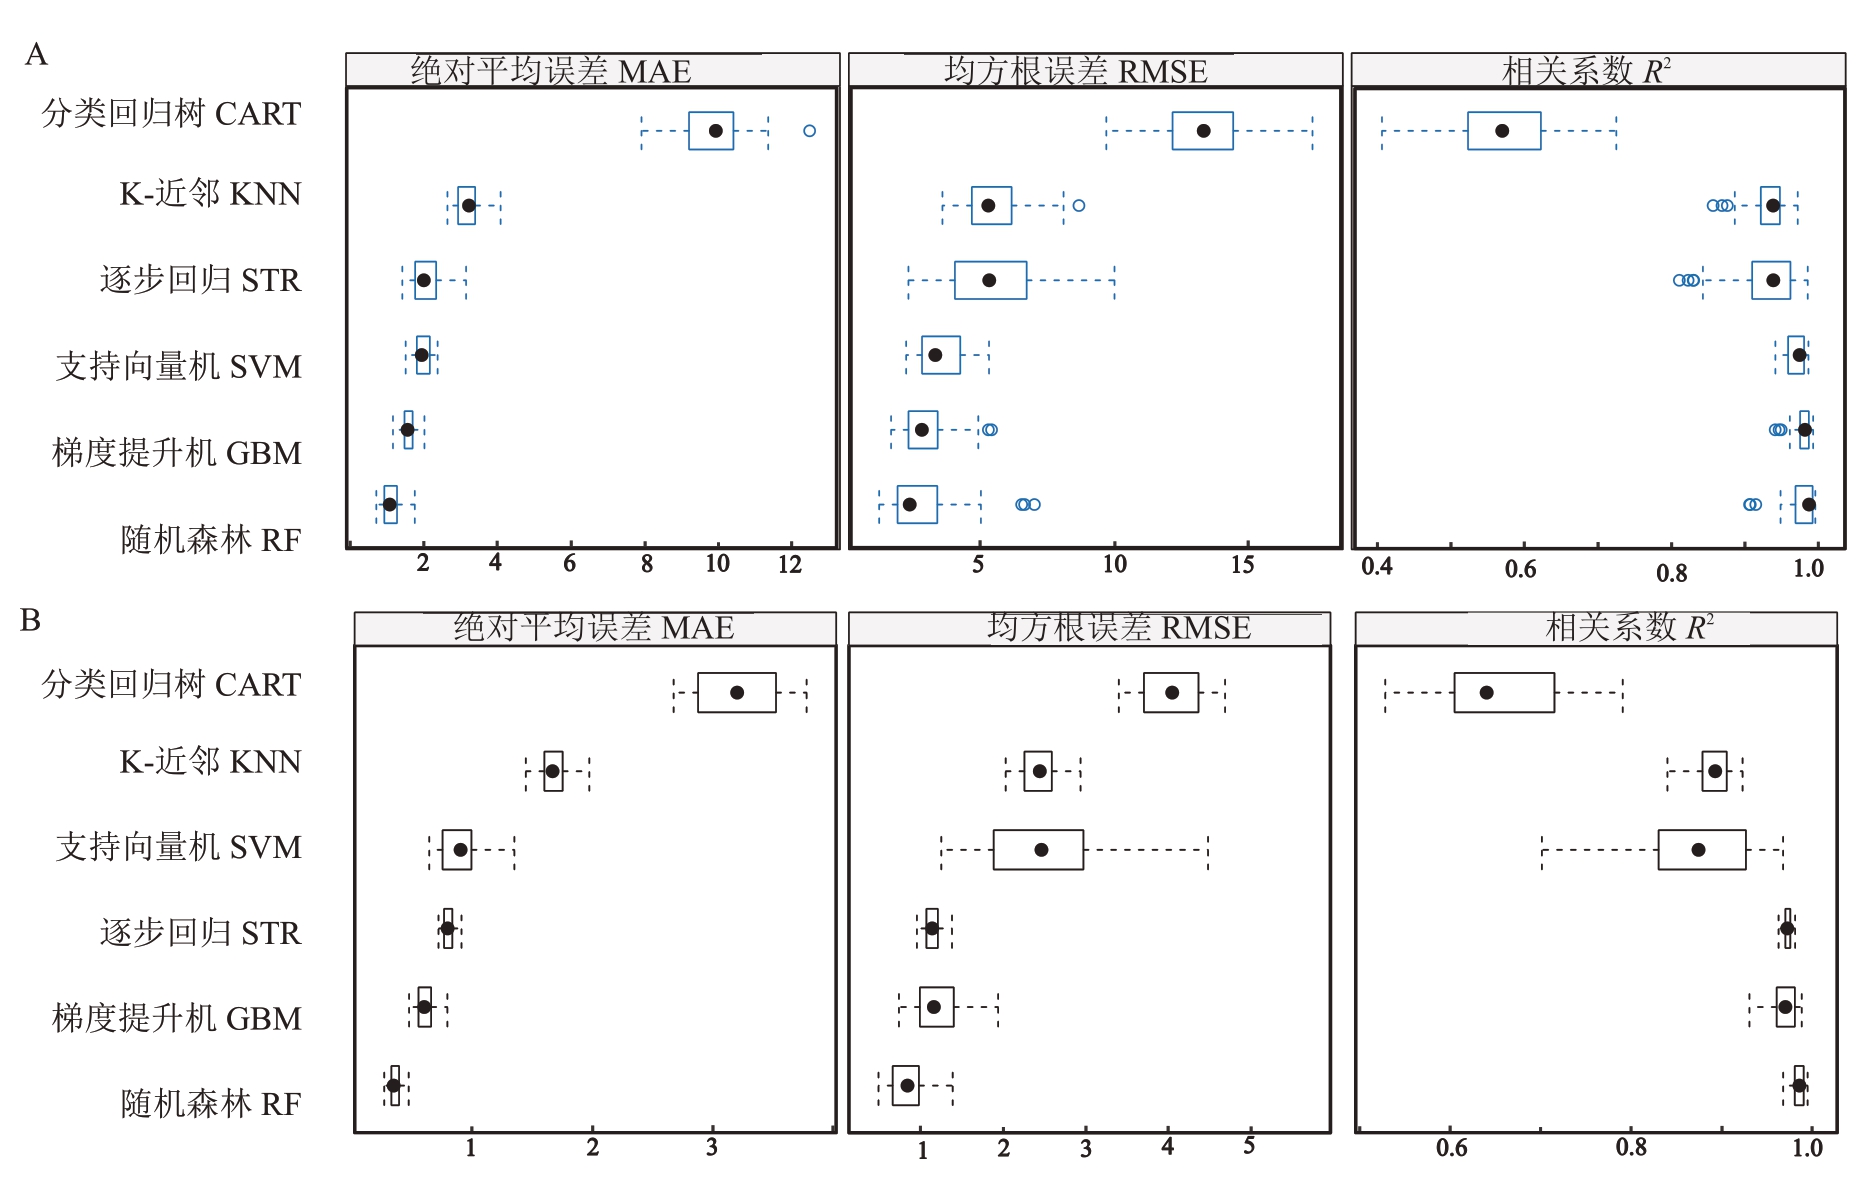
图4 几个回归模型对花穗发育持续期(A)以及开花持续期(B)的预测能力的初步比较
Fig.4 Preliminary comparison of the predictive ability of regresstion models for the duration of inflorescence elongation(A)and the duration of blooming(B)
对于花穗发育持续期,最终确定RF模型参数为mtry=8,ntree=4000,STR模型最终确定参数nvmax=3;对于开花持续期,最终确定RF模型参数为mtry=8,ntree=4000,STR模型最终确定参数nvmax=3。以上参数下预测模型RMSE 最小,错误率较低而且较稳定,降低了数据依赖性,确定为模型的最佳参数。
对于花穗发育持续期,RF模型RMSE值为3.75±0.01,RP2值为0.97±0.00(表2 和图5-A),STR 模型RMSE值为3.65±0.00,RP2值为0.97±0.00(表2和图5-B);RF模型对测试集的预测RP2值为0.99,高于STR模型的0.96;对2017和2018两年盲测数据的预测RP2值分别为0.99 和0.98,稍高于STR(图5-C 和图5-D)。对于开花持续期,RF 模型RMSE 值为2.60±0.00,RP2 值为0.88±0.00(表2 和图6-A),STR 模型RMSE值为1.19±0.00,RP2值为0.97±0.00(表2和图6-B);RF模型对测试集的预测RP2值为0.98,稍高于STR模型的0.97;对2017和2018两年盲测数据的预测RP2值分别为0.98和0.98,高于STR的0.97和0.96(图6-C和图6-D)。可见两个模型都有很好的鲁棒性,RF模型比STR模型对花穗发育持续期和开花持续期变量有更好的预测性能,对不同年度的预测表现更稳定。
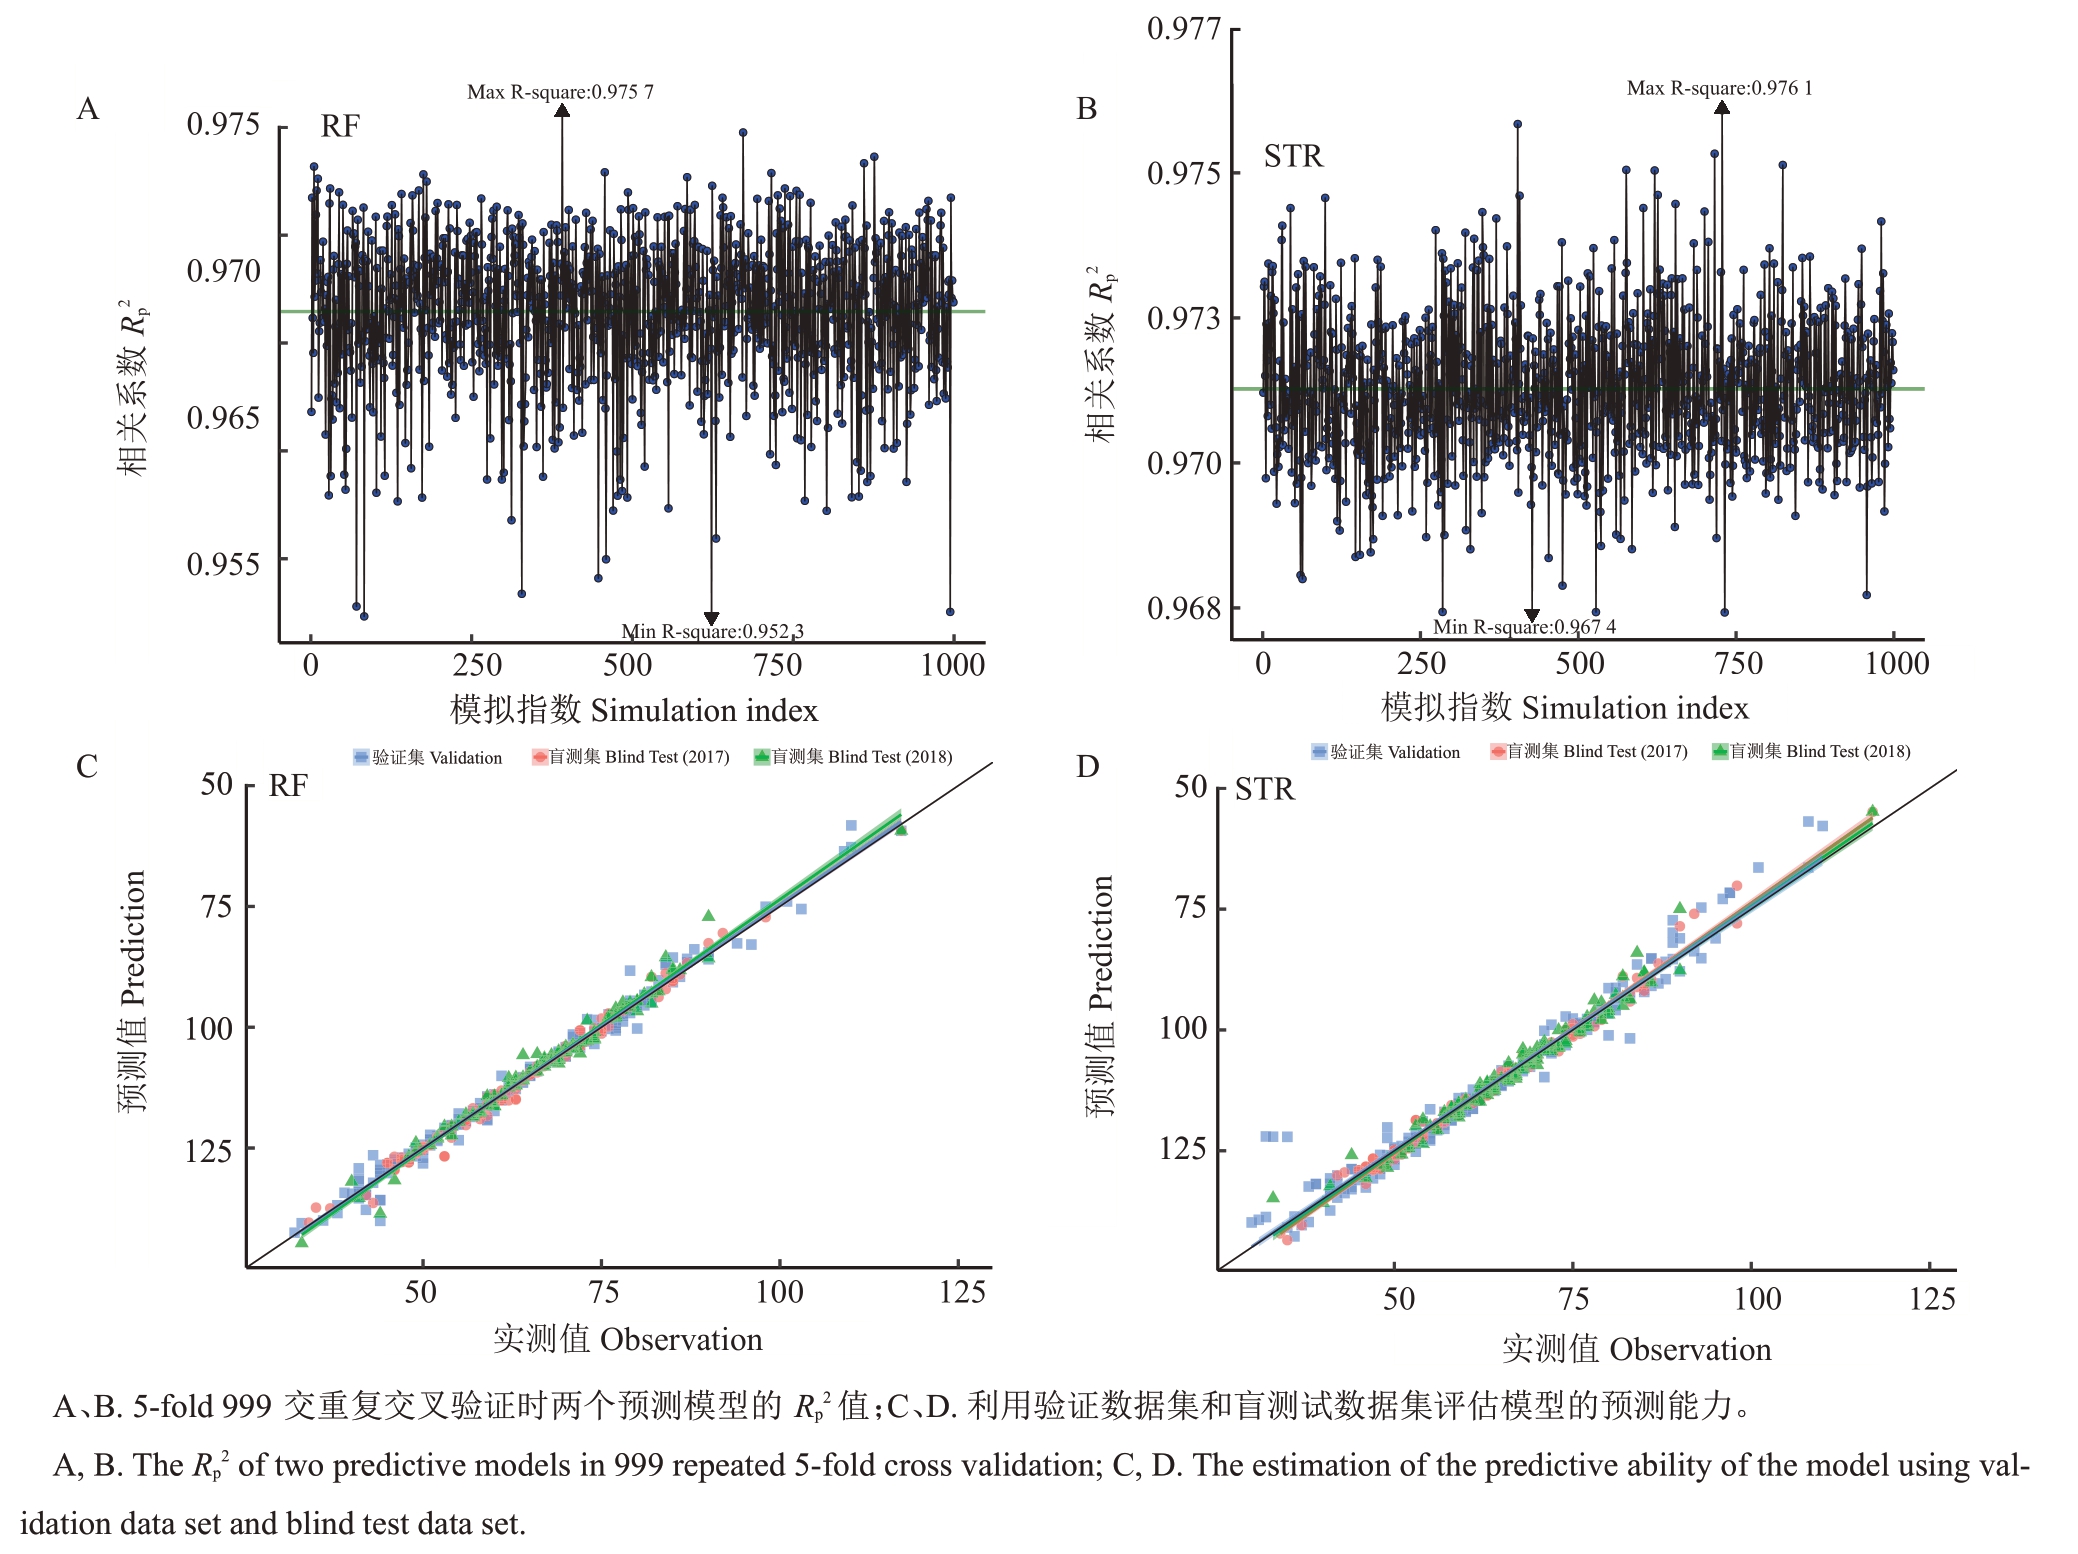
图5 对花穗发育持续期预测模型的鲁棒性和预测准确性评估
Fig.5 The evaluation of robustness and accuracy of predictive models for the duration of inflorescence elongation
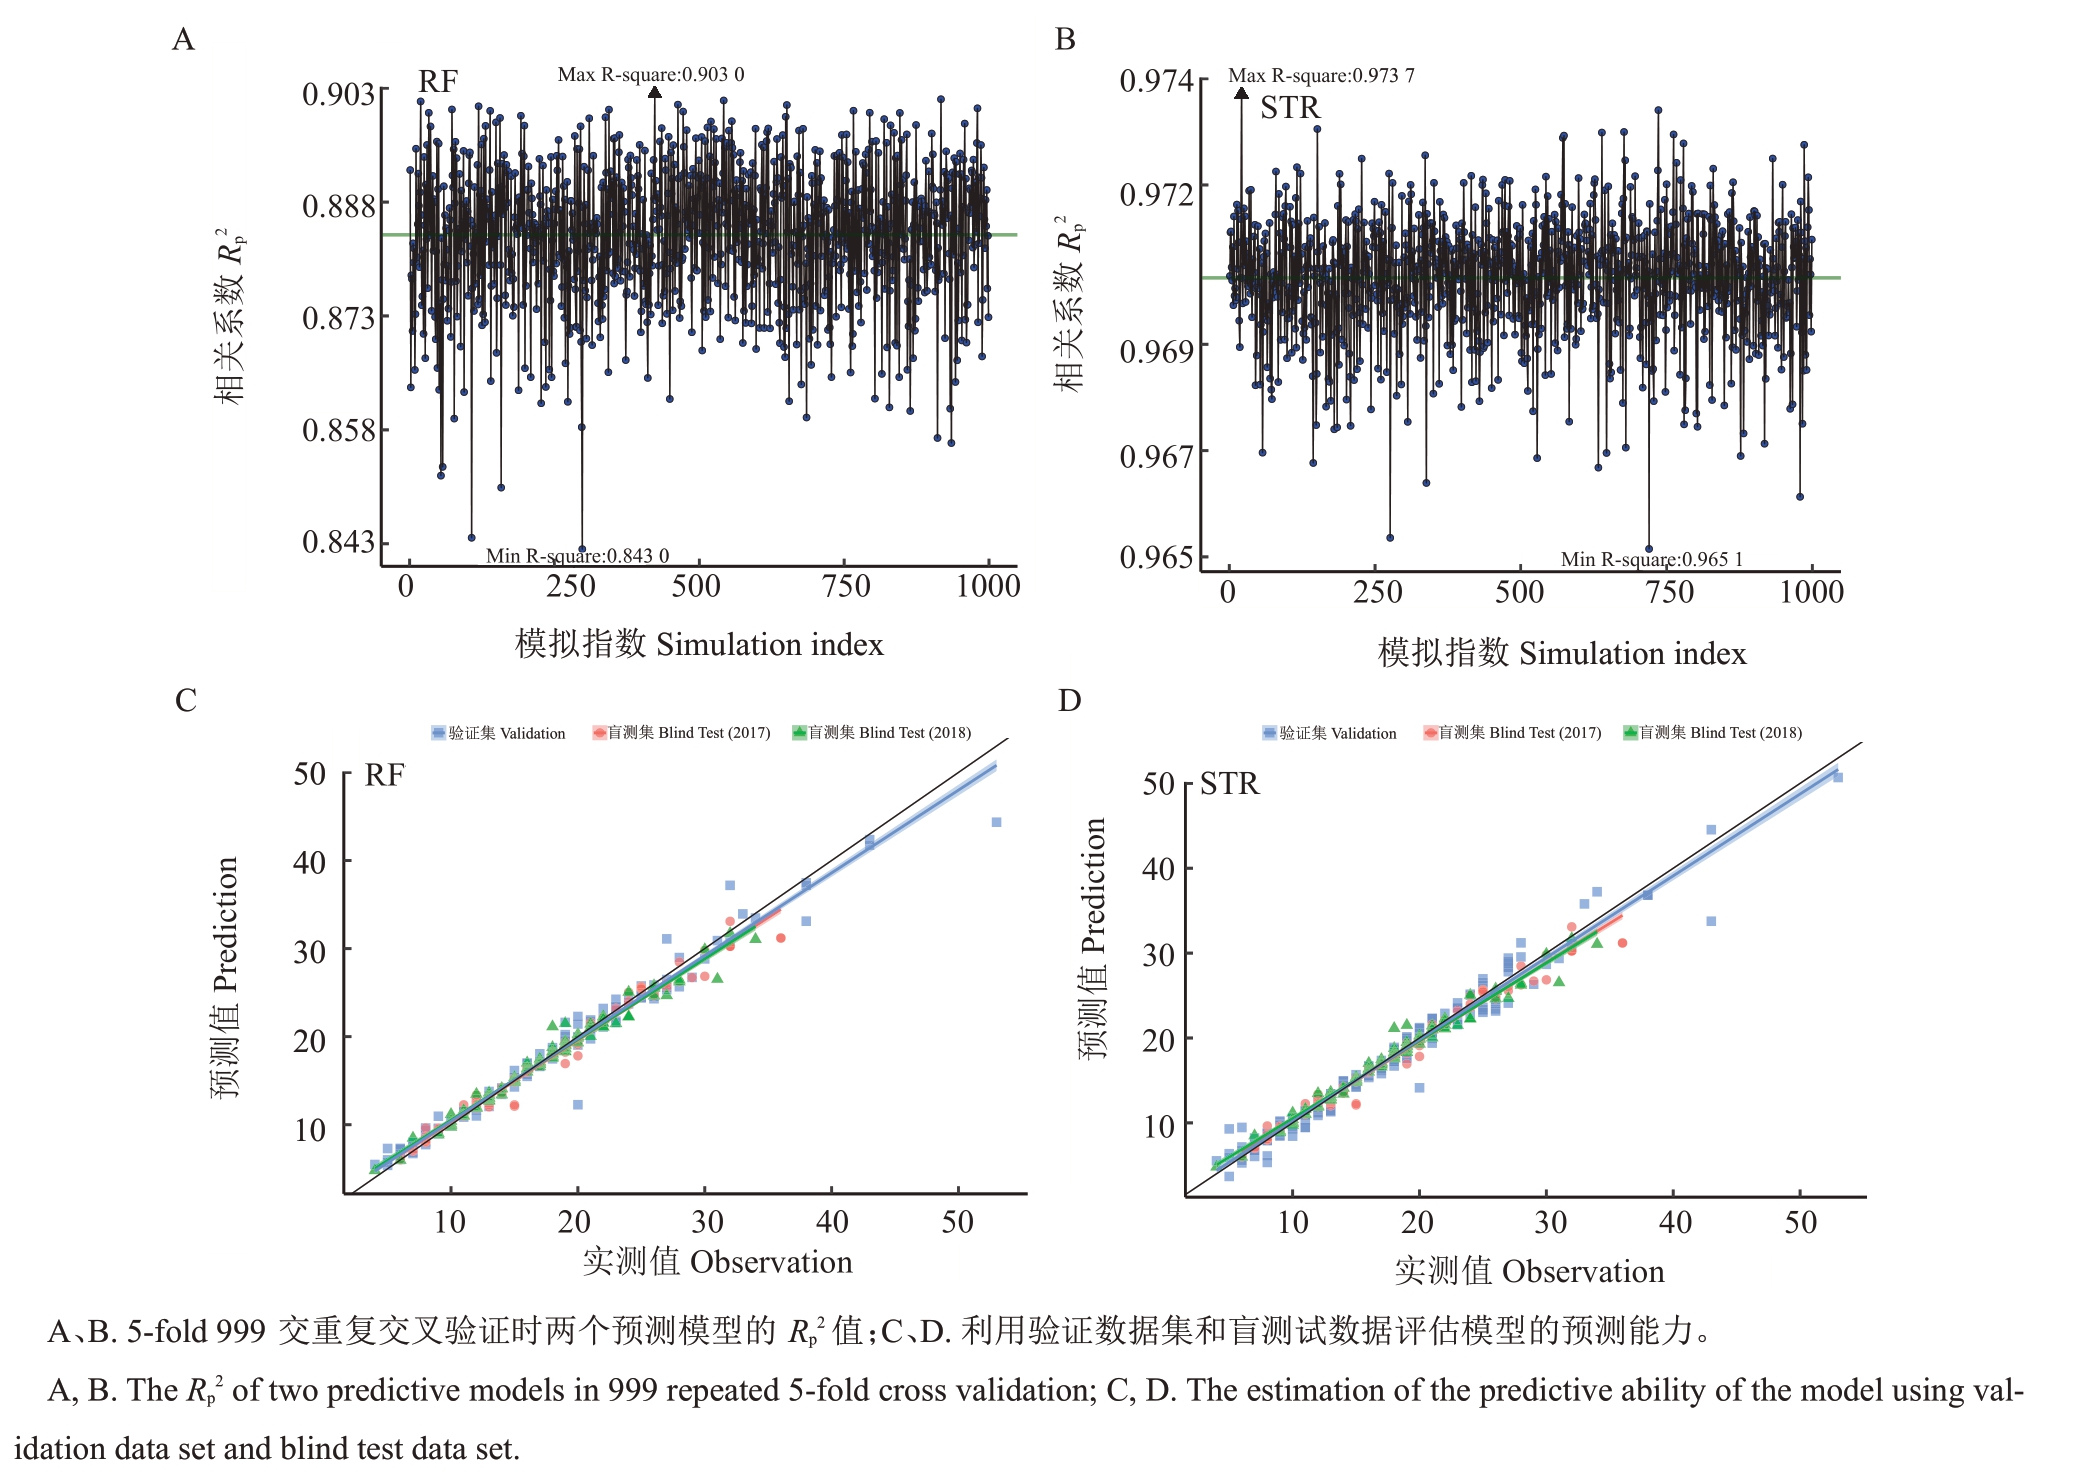
图6 对开花持续期预测模型的鲁棒性和预测准确性评估
Fig.6 The evaluation of robustness and accuracy of predictive models for the duration of blooming
表2 随机森林模型和逐步回归模型鲁棒性评价
Table 2 Robustness evaluation of Random Forest models and Stepwise Regression models

模型Model数据库Dataset特征数量No.of features数据量Records随机森林Random Forest,RF 1102 5次交叉验证,重复999次5 fold cross validation,999 repeats平均绝对误差MAE 1.70±0.00均方根误差RMSE 3.75±0.01 1102花穗发育持续期Inflorence development duration,IDD花穗发育持续期Inflorence development duration,IDD开花持续期Blooming duration,BD开花持续期Blooming duration,BD逐步回归Stepwise Regression,STR 2.06±0.00 881 0 3.65±0.000.97±0.00(0.97~0.98)随机森林Random Forest,RF逐步回归Stepwise Regression,STR 1.67±0.00 0.80±0.00 2.59±0.00 1.19±0.00 1102 1102 0.88±0.00(0.84~0.90)0.97±0.00(0.97~0.97)10相关系数Rp2(range)0.97±0.00(0.97~0.98)
假设两因变量与最重要的性状呈线性关系,从而获得显式模式STR预测的线性方程:

从以上方程可见,平均空气相对湿度、大于5 ℃积温与花穗发育持续期呈正相关,而平均大气温度与花穗发育持续期呈负相关。平均风力、大于5 ℃积温与开花持续期呈正相关,而平均大气温度、大于18 ℃积温与开花持续期呈负相关。
2.4 特征重要性评价
用RF 算法模基于不纯度降低对特征重要性进行排序,结合单个特征与CORRp和CORRsp表示的花穗发育持续期和开花持续期的相关性来评估特征的重要性。对于每个特征携带的信息,RF算法的重要性提供非线性评估,而两个相关系数分别给出线性和单调评估。
从图7-A 可以看出,大于5 ℃积温对花穗发育持续期模型变量重要性、线性和单调相关性都最高;平均大气温度对花穗发育持续期的非线性相关性要高于线性和单调相关;平均风力与花穗发育持续期呈负线性相关,变量重要性较高,高于平均降雨量和平均空气相对湿度,现“白点”日对花穗发育持续期模型的重要性则较低。从图7-B 可以看出,对开花持续期模型变量重要性前4 位的特征,它们与因变量的线性相关性和单调相关性表现与花穗发育持续期模型相同。而初花日、现“白点”日和花穗发育持续期对开花持续期模型的重要性则较低。另外,大于18 ℃积温对开花持续期模型的影响要高于大于24 ℃积温对花穗发育持续期模型的影响,可见,花发育后期对高温的敏感性要强于花发育早期。
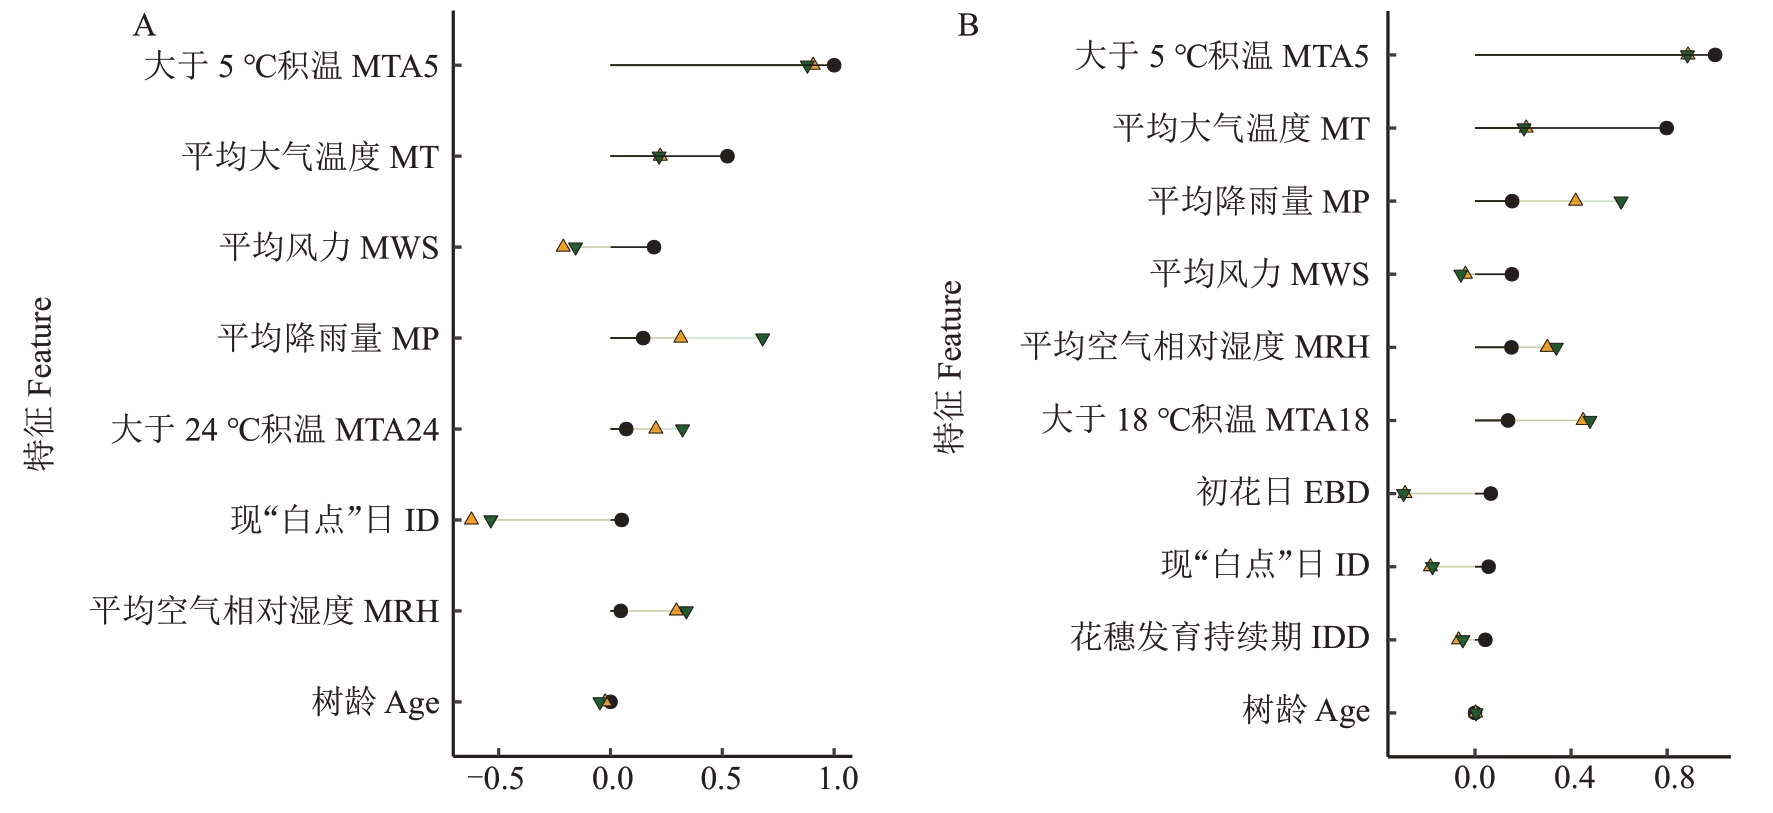
图7 随机森林算法评估特征的对花穗发育持续期(A)和开花持续期(B)的重要性(黑色椭圆)、Pearson(橙色三角形)相关性和Spearman(深绿色三角形)相关性
Fig.7 Ranking of relative feature importance(black oval)using Random Forest,Pearson(orange triangle)and Spearman(dark green triangle)correlation coefficients between features and the duration of inflorescence elongation(A)and the duration of blooming(B)
3 讨 论
3.1 建立物候与气象数据库的意义
地面观测是一种传统的物候学研究方法[19-20],可以准确地记录特定地点和物种的物候时间,提供物候变化的第一手直接证据。近年来卫星遥感通过检测与绿色相关的植被指数[21]、叶绿素荧光[22]或高频采集图像[23]等手段拓展了传统植物物候观测的视野,但这些方法仍存在空间分辨率和图像解释准确率低等缺陷,因此地面观测获得物候期数据仍然是常绿果树特别是荔枝物候研究最可靠的手段。国家荔枝龙眼产业体系自2009 年成立以来,在广东、广西、海南、福建、云南和四川6 个省区的荔枝产区设立荔枝物候期观察点,统一制定物候期指标和判断标准。自观测体系运行以来,已系统记录超过1500条数据,为挖掘数据关系和研究荔枝物候打下了重要基础。
3.2 模型评价及特征的意义分析
物候模型是研究植物物候对未来气候变化响应的重要工具[10-11],多数物候模型基于“度-日”概念,只关注特定时期内温度总和,忽略了温度的时间变化,此外空气湿度、降雨量等可能对植物物候产生重要影响的气象因子尚未很好地嵌入到现有的物候模型中,使得极端气候条件或全球变暖趋势下统计模型可能会导致相当大的偏差[24]。而且物候期与荔枝的成花率以及产量关系密切。笔者课题组在广州地区对荔枝的4个品种——妃子笑、怀枝、桂味和糯米糍进行了系统的农业气象研究,发现调控这些品种的末次秋梢成熟期在10 月16 日至10 月31 日之间,以及确保在1 月15 日前出现花芽分化“白点”,可以在多变的农业气象条件下实现高成花率和高产出[3]。
温度通常被认为是植物物候的主要控制因素[10,25]。一般认为春季昼间20 ℃以上、夜间低至10 ℃以下有利于荔枝开花[4],但物候事件对温度变化的反应在很大程度上是非线性的[26]。降水已被认为是干旱半干旱地区调节植物物候的主要因子,荔枝在土壤保持干旱的情况下并不能开花[6]。空气湿度可能影响植物的春季物候[7],因物种不同有所差异[27]。本研究结果表明,风力超过5 级时会对果树开花坐果造成危害[8],微风湿润天气可能促进授粉[9],有待结合田间试验验证。大于5 ℃积温以及开花过程中的平均气温对花穗发育持续时间影响最大。大于24 ℃积温加速花芽分化,但持续高温可能降低成花率,与前人的报道一致[4]。此外,平均温度、平均风力和平均降雨量对花发育早期模型与花发育后期模型都有重要影响,而在花发育后期对高温的敏感性要强于花发育早期。
笔者在本研究中聚焦于主效应,但随机森林算法通过节点分裂亦能自动捕捉特征交互作用,特征重要性排序也间接反映了交互效应。通过随机森林评估了特征重要性,发现非线性效应(如平均大气温度对花穗发育持续期的非线性影响)、积温(大于5 ℃积温)与温度(平均大气温度)的耦合通过RF模型的不纯度降低体现。STR模型的关系式也反映了各特征之间的数量关系。后续可结合因果推断方法(如贝叶斯网络)和结合SHAP值等解释性方法进行深入分析。
3.3 研究结果的意义、作用与应用
自2014年以来中国荔枝种植面积超过3.6万hm2,年产量均超过200 万t,种植环节直接产值达280 多亿元[28],但接近一半荔枝集中在6 月份成熟上市[29],产期重叠给各产区带来很大的鲜销压力。对各荔枝主产区和品种成熟时间进行预测判断,可以为各地提早制定销售预案,减少市场风险,对产业稳定发展有着重要意义。花穗发育至开花最终到谢花持续时间的长短影响果实成熟的早晚和产量。建立稳定可靠的花发育预测模型,可以加深对荔枝开花进程的认识,在预测天气变化的基础上形成有针对性地调控花期和果实成熟期的农艺措施,有较高的应用价值。
4 结 论
建立了针对花穗发育持续期和开花持续期的RF和STR回归模型。基于5倍交叉验证和999次鲁棒性测试,对花穗发育持续期预测均方根误差为3.6~3.7 d(R2≥0.97),盲测R2≥0.96;开花持续期均方根误差1.2~2.6 d(R2≥0.88),盲测R2≥0.96,说明该系列模型有较高的准确性和稳健性;大于5 ℃日积温、日平均温度、风级以及降雨量对荔枝花的整个开放过程起着重要作用,大于24 ℃积温对花穗发育影响显著,可为花期调控提供决策依据。
致谢:研究工作得到国家荔枝龙眼产业技术体系海口、儋州、湛江、茂名、深圳、玉林、钦州、北海、漳州、宁德、泸州、保山等综合试验站及荔枝示范园园主帮助,特此致谢!
[1] 李建国.荔枝学[M].北京:中国农业出版社,2008:44.LI Jianguo. The litchi[M]. Beijing:China Agriculture Press,2008:44.
[2] MENZEL C M. The control of floral initiation in lychee:A review[J].Scientia Horticulturae,1983,21(3):201-215.
[3] 苏钻贤,杨胜男,黄悦,万志远,申济源,陈厚彬.荔枝成花、坐果与现“白点”期和末次秋梢期成熟期的关系研究[J].果树学报,2023,40(8):1628-1639.SU Zuanxian,YANG Shengnan,HUANG Yue,WAN Zhiyuan,SHEN Jiyuan,CHEN Houbin. Relationship between flowering rate and fruit set,and the dates of“white millete”appearance and last autumn shoot flush maturation in litchi[J]. Journal of Fruit Science,2023,40(8):1628-1639.
[4] 陈厚彬,苏钻贤,张荣,张红娜,丁峰,周碧燕.荔枝花芽分化研究进展[J].中国农业科学,2014,47(9):1774-1783.CHEN Houbin,SU Zuanxian,ZHANG Rong,ZHANG Hongna,DING Feng,ZHOU Biyan.Progresses in research of litchi floral differentiation[J].Scientia Agricultura Sinica,2014,47(9):1774-1783.
[5] SU Z X,LIU L Y,LI Y Q,CHEN H B.Predicting flower induction of litchi(Litchi chinensis Sonn.)with machine learning techniques[J]. Computers and Electronics in Agriculture,2023,205:107572.
[6] 李志强,袁沛元,邱燕萍,李建光,凡超. 冬季灌溉与桂味荔枝成花率的关系初探[J]. 热带作物学报,2012,33(3):402-407.LI Zhiqiang,YUAN Peiyuan,QIU Yanping,LI Jianguang,FAN Chao. The relationship between winter irrigation and spring flowering of Guiwei litchi trees[J]. Chinese Journal of Tropical Crops,2012,33(3):402-407.
[7] SPARKS T H,MENZEL A. Observed changes in seasons:An overview[J].International Journal of Climatology,2002,22(14):1715-1725.
[8] 张倩.影响库尔勒香梨开花与果实生长的气象条件分析[D].乌鲁木齐:新疆师范大学,2013.ZHANG Qian.Analysis of the effect of meteorological conditions on the flowering and fruit growth of Korla Fragrant Pear[D].Urumqi:Xinjiang Normal University,2013.
[9] 范晓明,袁德义,唐静,田晓明,张旭辉,王碧芳,谭晓风.锥栗开花授粉生物学特性[J].林业科学,2014,50(10):42-48.FAN Xiaoming,YUAN Deyi,TANG Jing,TIAN Xiaoming,ZHANG Xuhui,WANG Bifang,TAN Xiaofeng.Biological characteristics of flowering and pollination in Castanea henryi[J].Scientia Silvae Sinicae,2014,50(10):42-48.
[10] CLELAND E E,CHUINE I,MENZEL A,MOONEY H A,SCHWARTZ M D.Shifting plant phenology in response to global change[J]. Trends in Ecology & Evolution,2007,22(7):357-365.
[11] LIU Q,PIAO S L,FU Y H,GAO M D,PEÑUELAS J,JANSSENS I A. Climatic warming increases spatial synchrony in spring vegetation phenology across the Northern Hemisphere[J].Geophysical Research Letters,2019,46(3):1641-1650.
[12] REICHSTEIN M,CAMPS-VALLS G,STEVENS B,JUNG M,DENZLER J,CARVALHAIS N,PRABHAT. Deep learning and process understanding for data-driven earth system science[J].Nature,2019,566(7743):195-204.
[13] ALMEIDA J,DOS SANTOS J A,ALBERTON B,TORRES R D S,MORELLATO L P C.Applying machine learning based on multiscale classifiers to detect remote phenology patterns in Cerrado savanna trees[J].Ecological Informatics,2014,23:49-61.
[14] DAI W J,JIN H Y,ZHANG Y H,LIU T,ZHOU Z Q.Detecting temporal changes in the temperature sensitivity of spring phenology with global warming:Application of machine learning in phenological model[J]. Agricultural and Forest Meteorology,2019,279:107702.
[15] THESSEN A.Adoption of machine learning techniques in ecology and earth science[J].One Ecosystem,2016,1:e8621.
[16] CZERNECKI B,NOWOSAD J,JABŁOŃSKA K. Machine learning modeling of plant phenology based on coupling satellite and gridded meteorological dataset[J]. International Journal of Biometeorology,2018,62(7):1297-1309.
[17] BREIMAN L. Random forests[J]. Machine Learning,2001,45(1):5-32.
[18] ZHAO H S,ZHU X C,LI C,WEI Y,ZHAO G X,JIANG Y M.Improving the accuracy of the hyperspectral model for apple canopy water content prediction using the equidistant sampling method[J].Scientific Reports,2017,7(1):11192.
[19] AONO Y,KAZUI K. Phenological data series of cherry tree flowering in Kyoto,Japan,and its application to reconstruction of springtime temperatures since the 9th century[J]. International Journal of Climatology,2008,28(7):905-914.
[20] SPARKS T H,CAREY P D.The responses of species to climate over two centuries:An analysis of the Marsham phenological record,1736-1947[J].Journal of Ecology,1995,83(2):321.
[21] LIU Q,PIAO S L,JANSSENS I A,FU Y S,PENG S S,LIAN X,CIAIS P,MYNENI R B,PEÑUELAS J,WANG T.Extension of the growing season increases vegetation exposure to frost[J].Nature Communications,2018,9(1):426.
[22] SMITH W K,BIEDERMAN J A,SCOTT R L,MOORE D J P,HE M,KIMBALL J S,YAN D,HUDSON A,BARNES M L,MACBEAN N,FOX A M,LITVAK M E. Chlorophyll fluorescence better captures seasonal and interannual gross primary productivity dynamics across dryland ecosystems of southwestern North America[J]. Geophysical Research Letters,2018,45(2):748-757.
[23] RICHARDSON A D,HUFKENS K,MILLIMAN T,AUBRECHT D M,CHEN M,GRAY J M,JOHNSTON M R,KEENAN T F,KLOSTERMAN S T,KOSMALA M,MELAAS E K,FRIEDL M A,FROLKING S. Tracking vegetation phenology across diverse North American biomes using PhenoCam imagery[J]. Scientific Data,2018,5:180028.
[24] LIU Q,FU Y H,LIU Y W,JANSSENS I A,PIAO S L.Simulating the onset of spring vegetation growth across the Northern Hemisphere[J].Global Change Biology,2018,24(3):1342-1356.
[25] CHUINE I.A unified model for budburst of trees[J]. Journal of Theoretical Biology,2000,207(3):337-347.
[26] FU Y H,PIAO S L,VITASSE Y,ZHAO H F,DE BOECK H J,LIU Q,YANG H,WEBER U,HÄNNINEN H,JANSSENS I A.Increased heat requirement for leaf flushing in temperate woody species over 1980-2012:Effects of chilling,precipitation and insolation[J].Global Change Biology,2015,21(7):2687-2697.
[27] LAUBE J,SPARKS T H,ESTRELLA N,MENZEL A.Does humidity trigger tree phenology? Proposal for an air humidity based framework for bud development in spring[J].New Phytologist,2014,202(2):350-355.
[28] 陈厚彬.我国荔枝产业发展情况:在2018 年中国国际荔枝产业大会开摘节暨新闻发布会上的讲话[J].中国热带农业,2018(3):6-7.CHEN Houbin. The development of China’s litchi industry:In the 2018 China International Litchi Industry Conference opening festival and press conference speech[J].China Tropical Agriculture,2018(3):6-7.
[29] 苏钻贤,杨胜男,陈厚彬,申济源.2020 年我国荔枝主产区的生产形势分析[J].南方农业学报,2020,51(7):1598-1605.SU Zuanxian,YANG Shengnan,CHEN Houbin,SHEN Jiyuan.Analysis of the production situation for litchi in main planting areas of China in 2020[J]. Journal of Southern Agriculture,2020,51(7):1598-1605.