中国是猕猴桃最大的生产国和消费国[1]。猕猴桃在中国不同地区存在明显的区域适应性,同一品种因地处不同生境条件,果实品质存在较大差异。由于缺乏品种区划研究,很多地区在引种时存在较大的盲目性与跟随性,致使当前中国猕猴桃品种布局不合理,优良品种不能发挥最大效益,不仅损害果农利益,也影响消费者对中国猕猴桃品质的认可。果实综合评价能够反映品种品质特征,为品种合理布局提供参考[2-3]。
果实品质评价方法主要有感官评价和仪器分析两种:感官评价易受主观因素影响,不能反映果实固有品质特征;仪器分析能有效反映果实品质[4-5]。当前猕猴桃品质研究多集中在栽培管理方面[6-8],虽有猕猴桃品质指标方面的报道,但测定指标较少,且多为同一区域不同品种的品质比较。廖钦洪等[9]对重庆市12 个区县的红阳猕猴桃果实品质指标进行了测定,并基于品质特征建立了综合评价体系,为重庆市红阳猕猴桃的种植布局提供了依据;江海等[10]测定了陕南主栽品种秦美、金魁、翠香、徐香、金艳、红阳等11 个猕猴桃果实品质指标,为陕南地区猕猴桃品种结构调整和产业发展提供了参考;沈川等[11]构建了秦巴山区20 份野生美味猕猴桃果实品质评价体系,探究野生美味猕猴桃种质资源多样性,为后续育种提供了基础。
针对单个猕猴桃品种的主成分分析和综合评价也有相关报道,刘科鹏等[12]通过对奉新县内15 个不同园区的金魁猕猴桃果实进行品质检测,建立了一套适合金魁猕猴桃果实品质评价的方法,为优质高效园区建设与栽培管理提供了参考。但同一品种的单区域研究不能反映该品种对不同生态区的适应性,不能反映其推广潜力。为了更加全面、深入、系统地开展同一品种猕猴桃品质检测,建立综合评价体系,笔者在本研究中以猕猴桃品种中猕2 号为材料,对中国不同地区的果实进行外观品质和内在品质检测,通过相关性分析和主成分分析建立果实综合评价体系,初步明确中国不同产区果实品质差异,为中猕2号合理布局与猕猴桃品种结构调控提供科学依据。
1 材料和方法
1.1 试验材料
从中国12 个省份(河南、山东、湖北、湖南、江西、浙江、上海、江苏、重庆、贵州、四川、云南)猕猴桃园区采集中猕2 号果实(表1)。随机选择3 株生长势一致的植株,按照NY/T 1392—2015《猕猴桃采收与贮运技术规范》中的适宜采收期指标统一采集果实,每株采集发育良好、大小均匀一致的果实30 个,共计90 个果实,单株设一小区、3 次生物学重复,进行果实外观品质和内在品质检测。果实单果质量、纵径和横径采集样品后立即测定;硬度、可溶性固形物含量、可滴定酸含量、干质量、鲜质量、维生素C含量、单宁含量、果糖含量、葡萄糖含量和蔗糖含量待后熟之后测定。
表1 中国不同地区中猕2 号采样地点的地理位置
Table 1 Geographical situation of Zhongmi No.2 fruits in different regions
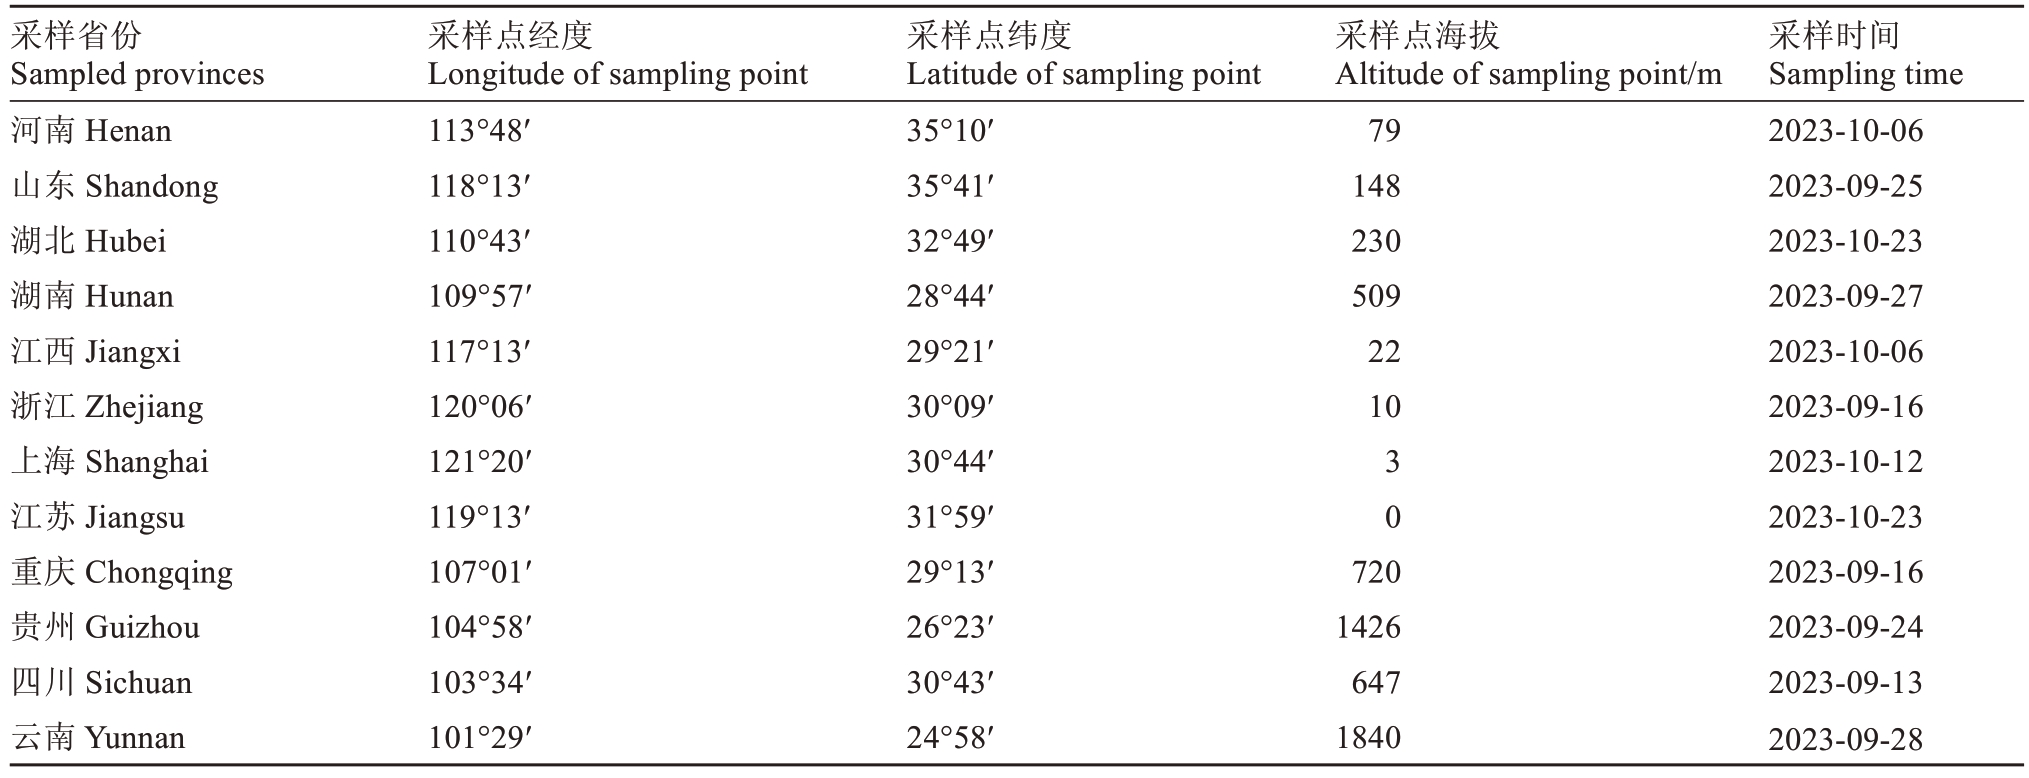
采样省份Sampled provinces河南Henan山东Shandong湖北Hubei湖南Hunan江西Jiangxi浙江Zhejiang上海Shanghai江苏Jiangsu重庆Chongqing贵州Guizhou四川Sichuan云南Yunnan采样点经度Longitude of sampling point 113°48′118°13′110°43′109°57′117°13′120°06′121°20′119°13′107°01′104°58′103°34′101°29′采样点纬度Latitude of sampling point 35°10′35°41′32°49′28°44′29°21′30°09′30°44′31°59′29°13′26°23′30°43′24°58′采样点海拔Altitude of sampling point/m 79 148 230 509 22 10 3 0 720 1426 647 1840采样时间Sampling time 2023-10-06 2023-09-25 2023-10-23 2023-09-27 2023-10-06 2023-09-16 2023-10-12 2023-10-23 2023-09-16 2023-09-24 2023-09-13 2023-09-28
1.2 试验方法
使用电子天平测定中猕2 号果实单果质量,每个生物学重复测定30 个果实,共计90 个果实,3 个生物学重复;使用游标卡尺测定果实纵横径,每个生物学重复测定10 个果实,共计30 个果实,3 个生物学重复,果形指数=果实纵径/果实横径;使用数显GY-4-J测定果实硬度,每个生物学重复测定10个果实,共计30个果实,3个生物学重复;使用ATAGO数显测糖酸仪器PAL-BXIACID8 Master Kit 测定果实可溶性固形物和可滴定酸含量;内在品质指标维生素C、果糖、葡萄糖和蔗糖含量测定参考国家标准GB 5009.86—2016[13],单宁含量测定参考行业标准NY/T 1600—2008[14]。
1.3 数据分析
使用Excel 统计软件统计与整理数据;使用SPSS统计分析软件进行相关性及主成分分析。
2 结果与分析
2.1 中国不同地区中猕2号果实外观品质分析
不同地区的中猕2 号果实外观品质指标存在差异,四川中猕2 号单果质量最小,为93.98 g,上海中猕2 号单果质量最大,为142.45 g,所有样品的平均单果质量为110.07 g,变异系数为12.34%;果实横径、纵径和果形指数变异系数分别为4.80%、7.66%和6.28%,说明单果质量和果实形状受地区差异影响较小。不同地区果实硬度存在差异,变幅在0.54~1.36 kg·cm-2之间,变异系数为21.37%,说明硬度与单果质量和果实形状相比,易受不同地区影响,但变异系数仍小于30%,处于合理的离散程度内,相对稳定(表2)。综上所述,中猕2号果实外观品质受不同地区影响较小,表明中猕2 号外观具有较强的不同生态环境适应性。
表2 中国不同地区中猕2 号果实外观品质指标
Table 2 Appearance quality indexes of Zhongmi No.2 fruits in different regions of China

采样省份Sampled provinces河南Henan山东Shandong湖北Hubei湖南Hunan江西Jiangxi浙江Zhejiang上海Shanghai江苏Jiangsu重庆Chongqing贵州Guizhou四川Sichuan云南Yunnan均值Average变幅Range标准差Standard deviation变异系数CV/%单果质量Single fruit mass/g 118.82±16.01 101.54±21.45 111.40±22.18 95.82±18.30 114.37±6.92 94.19±8.80 142.45±15.43 112.22±9.45 113.68±20.65 104.96±19.10 93.98±11.54 117.42±13.43 110.07 93.98~142.42 13.58 12.34横径Horizontal diameter/cm 53.07±4.24 54.27±6.80 52.90±3.43 51.19±2.60 54.85±3.93 49.47±1.56 56.55±3.92 54.80±3.19 53.64±3.60 56.83±5.94 49.49±1.99 56.72±3.66 53.65 49.47~56.83 2.57 4.8纵径Vertical diameter/cm 73.78±4.44 60.63±7.38 69.82±4.27 63.72±4.00 69.47±4.09 61.77±3.10 78.04±3.10 70.10±2.53 67.42±6.32 64.85±3.56 62.76±3.66 69.86±3.37 67.69 60.63~78.04 5.18 7.66果形指数Fruit shape index 1.40±0.13 1.13±0.15 1.32±0.11 1.25±0.08 1.27±0.14 1.25±0.06 1.39±0.10 1.28±0.08 1.26±0.09 1.15±0.12 1.27±0.08 1.24±0.10 1.27 1.13~1.40 0.08 6.28硬度Firmness/(kg·cm-2)1.03±0.21 0.81±0.30 0.94±0.17 0.76±0.18 0.96±0.25 1.00±0.30 1.14±0.10 0.54±0.10 1.36±0.24 0.89±0.24 1.07±0.41 1.07±0.12 0.96 0.54~1.36 0.21 21.37
2.2 中国不同地区中猕2号果实内在品质分析
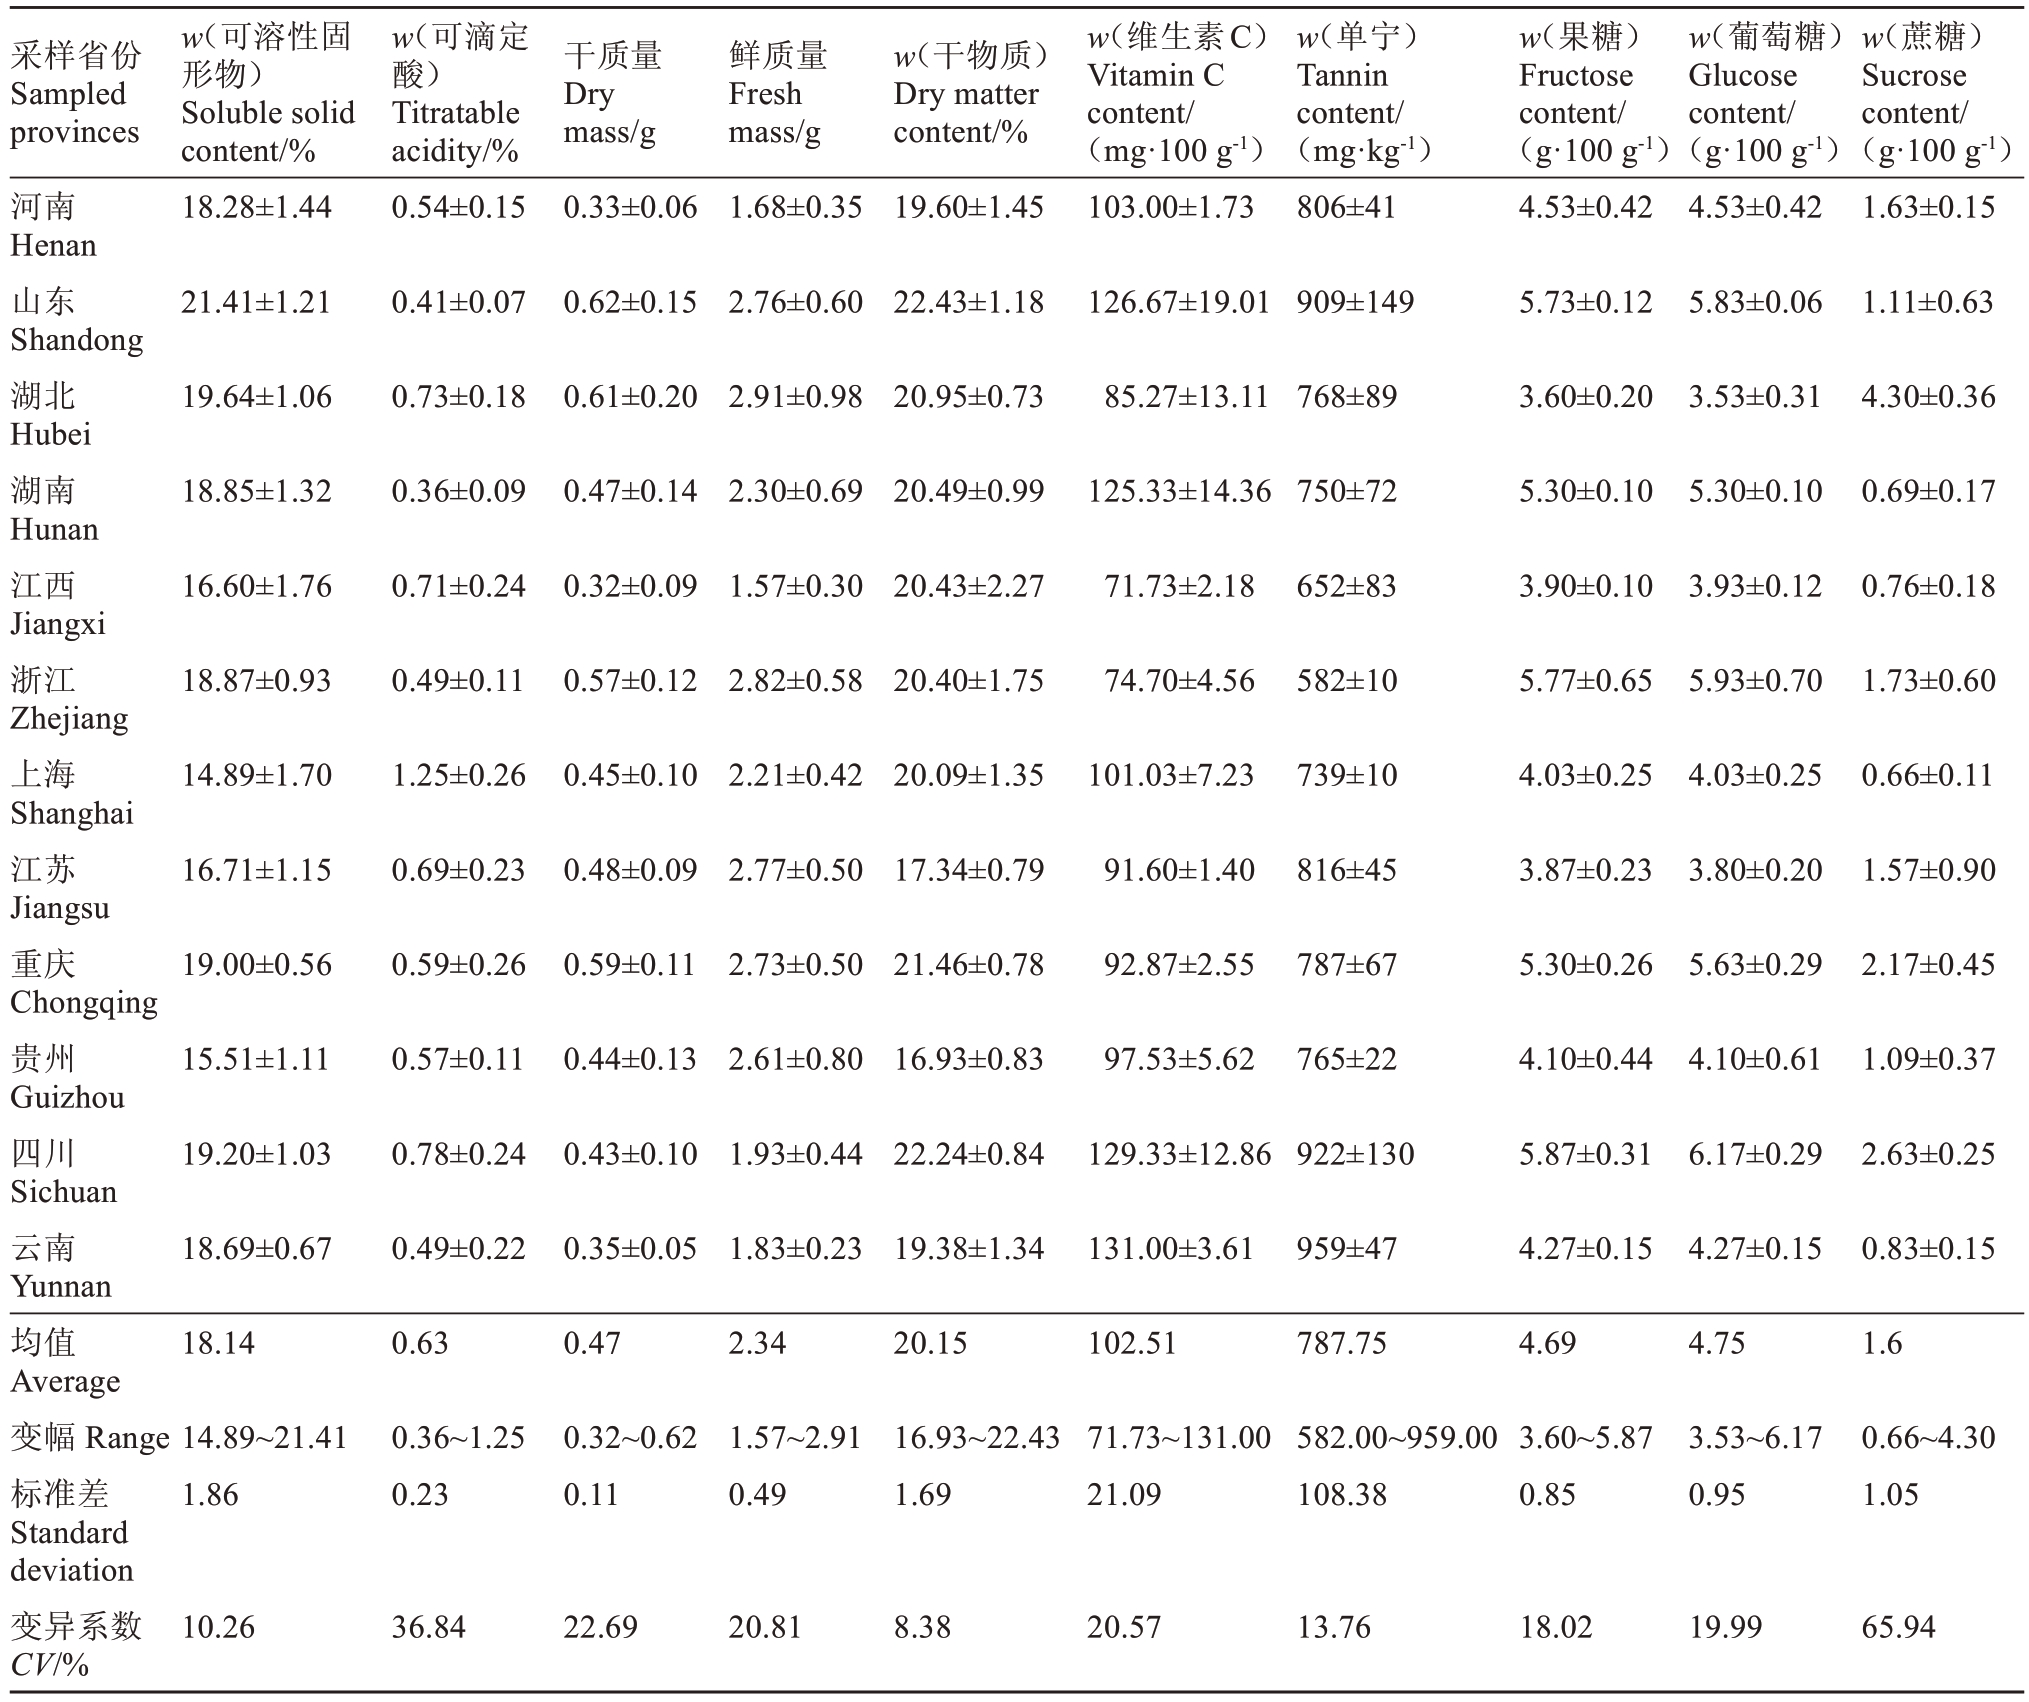
由表3可知,不同地区的中猕2号果实可溶性固形物含量(w,后同)平均值为18.14%,变异系数为10.26%,干物质含量平均值为20.15%,变异系数为8.38%,表明可溶性固形物和干物质含量受地区影响小,即中猕2 号糖度能够在不同生态区保持稳定水平;可滴定酸含量变幅为0.36%~1.25%,变异幅度较大,变异系数为36.84%,表明酸度受不同地区影响较大;维生素C 含量是猕猴桃果实的特征性指标,不同地区中猕2 号维生素C 含量平均值为102.51 mg·100 g-1,云南中猕2号(园区海拔1840 m)果实维生素C 含量最高,为131 mg·100 g-1,江西中猕2 号(园区海拔22 m)果实维生素C 含量最低,为71.73 mg·100 g-1,暗示高海拔可能促进中猕2号果实积累更多的维生素C;单宁是果实涩味的主要来源,不同地区中猕2号单宁含量平均值为787.75 mg·kg-1,变异系数为13.76%,离散程度低,表明单宁含量受地区影响小;果糖、葡萄糖和蔗糖是果实的主要可溶性糖,不同地区中猕2 号果糖和葡萄糖含量平均值分别为4.69 mg·100 g-1和4.75 mg·100 g-1,含量相当,离散系数分别为18.02%和19.99%,较为接近,而蔗糖含量平均值为1.60 mg·100 g-1,变异系数达65.94%,表明中猕2 号果实可溶性糖主要是果糖和葡萄糖,两者含量接近,在不同地区的表现相对稳定,而蔗糖含量相对较少,极易受到地区影响。
表3 中国不同地区中猕2 号猕猴桃果实内在品质指标
Table 3 Internal quality indexes of Zhongmi No.2 fruits in different regions of China
采样省份Sampled provinces干质量Dry mass/g鲜质量Fresh mass/g w(干物质)Dry matter content/%河南Henan山东Shandong湖北Hubei湖南Hunan江西Jiangxi浙江Zhejiang上海Shanghai江苏Jiangsu重庆Chongqing贵州Guizhou四川Sichuan云南Yunnan均值Average变幅Range标准差Standard deviation变异系数CV/%w(可溶性固形物)Soluble solid content/%18.28±1.44 w(可滴定酸)Titratable acidity/%0.54±0.15 0.33±0.06 1.68±0.35 19.60±1.45 w(维生素C)Vitamin C content/(mg·100 g-1)103.00±1.73 w(单宁)Tannin content/(mg·kg-1)806±41 w(果糖)Fructose content/(g·100 g-1)4.53±0.42 w(葡萄糖)Glucose content/(g·100 g-1)4.53±0.42 w(蔗糖)Sucrose content/(g·100 g-1)1.63±0.15 21.41±1.21 0.41±0.07 0.62±0.15 2.76±0.60 22.43±1.18 126.67±19.01 909±149 5.73±0.12 5.83±0.06 1.11±0.63 19.64±1.06 0.73±0.18 0.61±0.20 2.91±0.98 20.95±0.73 85.27±13.11 768±89 3.60±0.20 3.53±0.31 4.30±0.36 18.85±1.32 0.36±0.09 0.47±0.14 2.30±0.69 20.49±0.99 125.33±14.36 750±72 5.30±0.10 5.30±0.10 0.69±0.17 16.60±1.76 0.71±0.24 0.32±0.09 1.57±0.30 20.43±2.27 71.73±2.18 652±83 3.90±0.10 3.93±0.12 0.76±0.18 18.87±0.93 0.49±0.11 0.57±0.12 2.82±0.58 20.40±1.75 74.70±4.56 582±10 5.77±0.65 5.93±0.70 1.73±0.60 14.89±1.70 1.25±0.26 0.45±0.10 2.21±0.42 20.09±1.35 101.03±7.23 739±10 4.03±0.25 4.03±0.25 0.66±0.11 16.71±1.15 0.69±0.23 0.48±0.09 2.77±0.50 17.34±0.79 91.60±1.40 816±45 3.87±0.23 3.80±0.20 1.57±0.90 19.00±0.56 0.59±0.26 0.59±0.11 2.73±0.50 21.46±0.78 92.87±2.55 787±67 5.30±0.26 5.63±0.29 2.17±0.45 15.51±1.11 0.57±0.11 0.44±0.13 2.61±0.80 16.93±0.83 97.53±5.62 765±22 4.10±0.44 4.10±0.61 1.09±0.37 19.20±1.03 0.78±0.24 0.43±0.10 1.93±0.44 22.24±0.84 129.33±12.86 922±130 5.87±0.31 6.17±0.29 2.63±0.25 18.69±0.67 0.49±0.22 0.35±0.05 1.83±0.23 19.38±1.34 131.00±3.61 959±47 4.27±0.15 4.27±0.15 0.83±0.15 18.14 0.63 0.47 2.34 20.15 102.51 787.75 4.69 4.75 1.6 14.89~21.41 1.86 0.36~1.25 0.23 0.32~0.62 0.11 1.57~2.91 0.49 16.93~22.43 1.69 71.73~131.00 21.09 582.00~959.00 108.38 3.60~5.87 0.85 3.53~6.17 0.95 0.66~4.30 1.05 10.26 36.84 22.69 20.81 8.38 20.57 13.76 18.02 19.99 65.94
2.3 中猕2号果实品质指标的相关性分析
为了明确中猕2 号果实指标间的相关关系,对15 个果实外观和内在品质指标进行相关性分析(表4)。单果质量与果实横径、纵径和果形指数显著相关,表明果实横径、纵径和果形指数影响果实最终单果质量,此外,单果质量与可滴定酸含量显著相关;果实纵径与果形指数、可滴定酸含量显著相关;果形指数与可滴定酸含量显著相关;可溶性固形物含量与干物质、果糖、葡萄糖含量显著相关;干质量与鲜质量显著相关;干物质含量与果糖、葡萄糖含量显著相关,表明果糖、葡萄糖合成与积累影响果实最终干物质含量;维生素C含量与单宁含量显著相关,表明不同功能性物质间存在相关关系;果糖与葡萄糖含量极显著相关(表4)。上述结果表明不同地区中猕2 号果实品质指标间存在相关关系,因此,可以对有显著相关性的指标进行筛选,简化评价体系。
表4 中猕2 号果实品质指标相关性分析
Table 4 Correlation analysis of Zhongmi No.2 fruit quality indexes
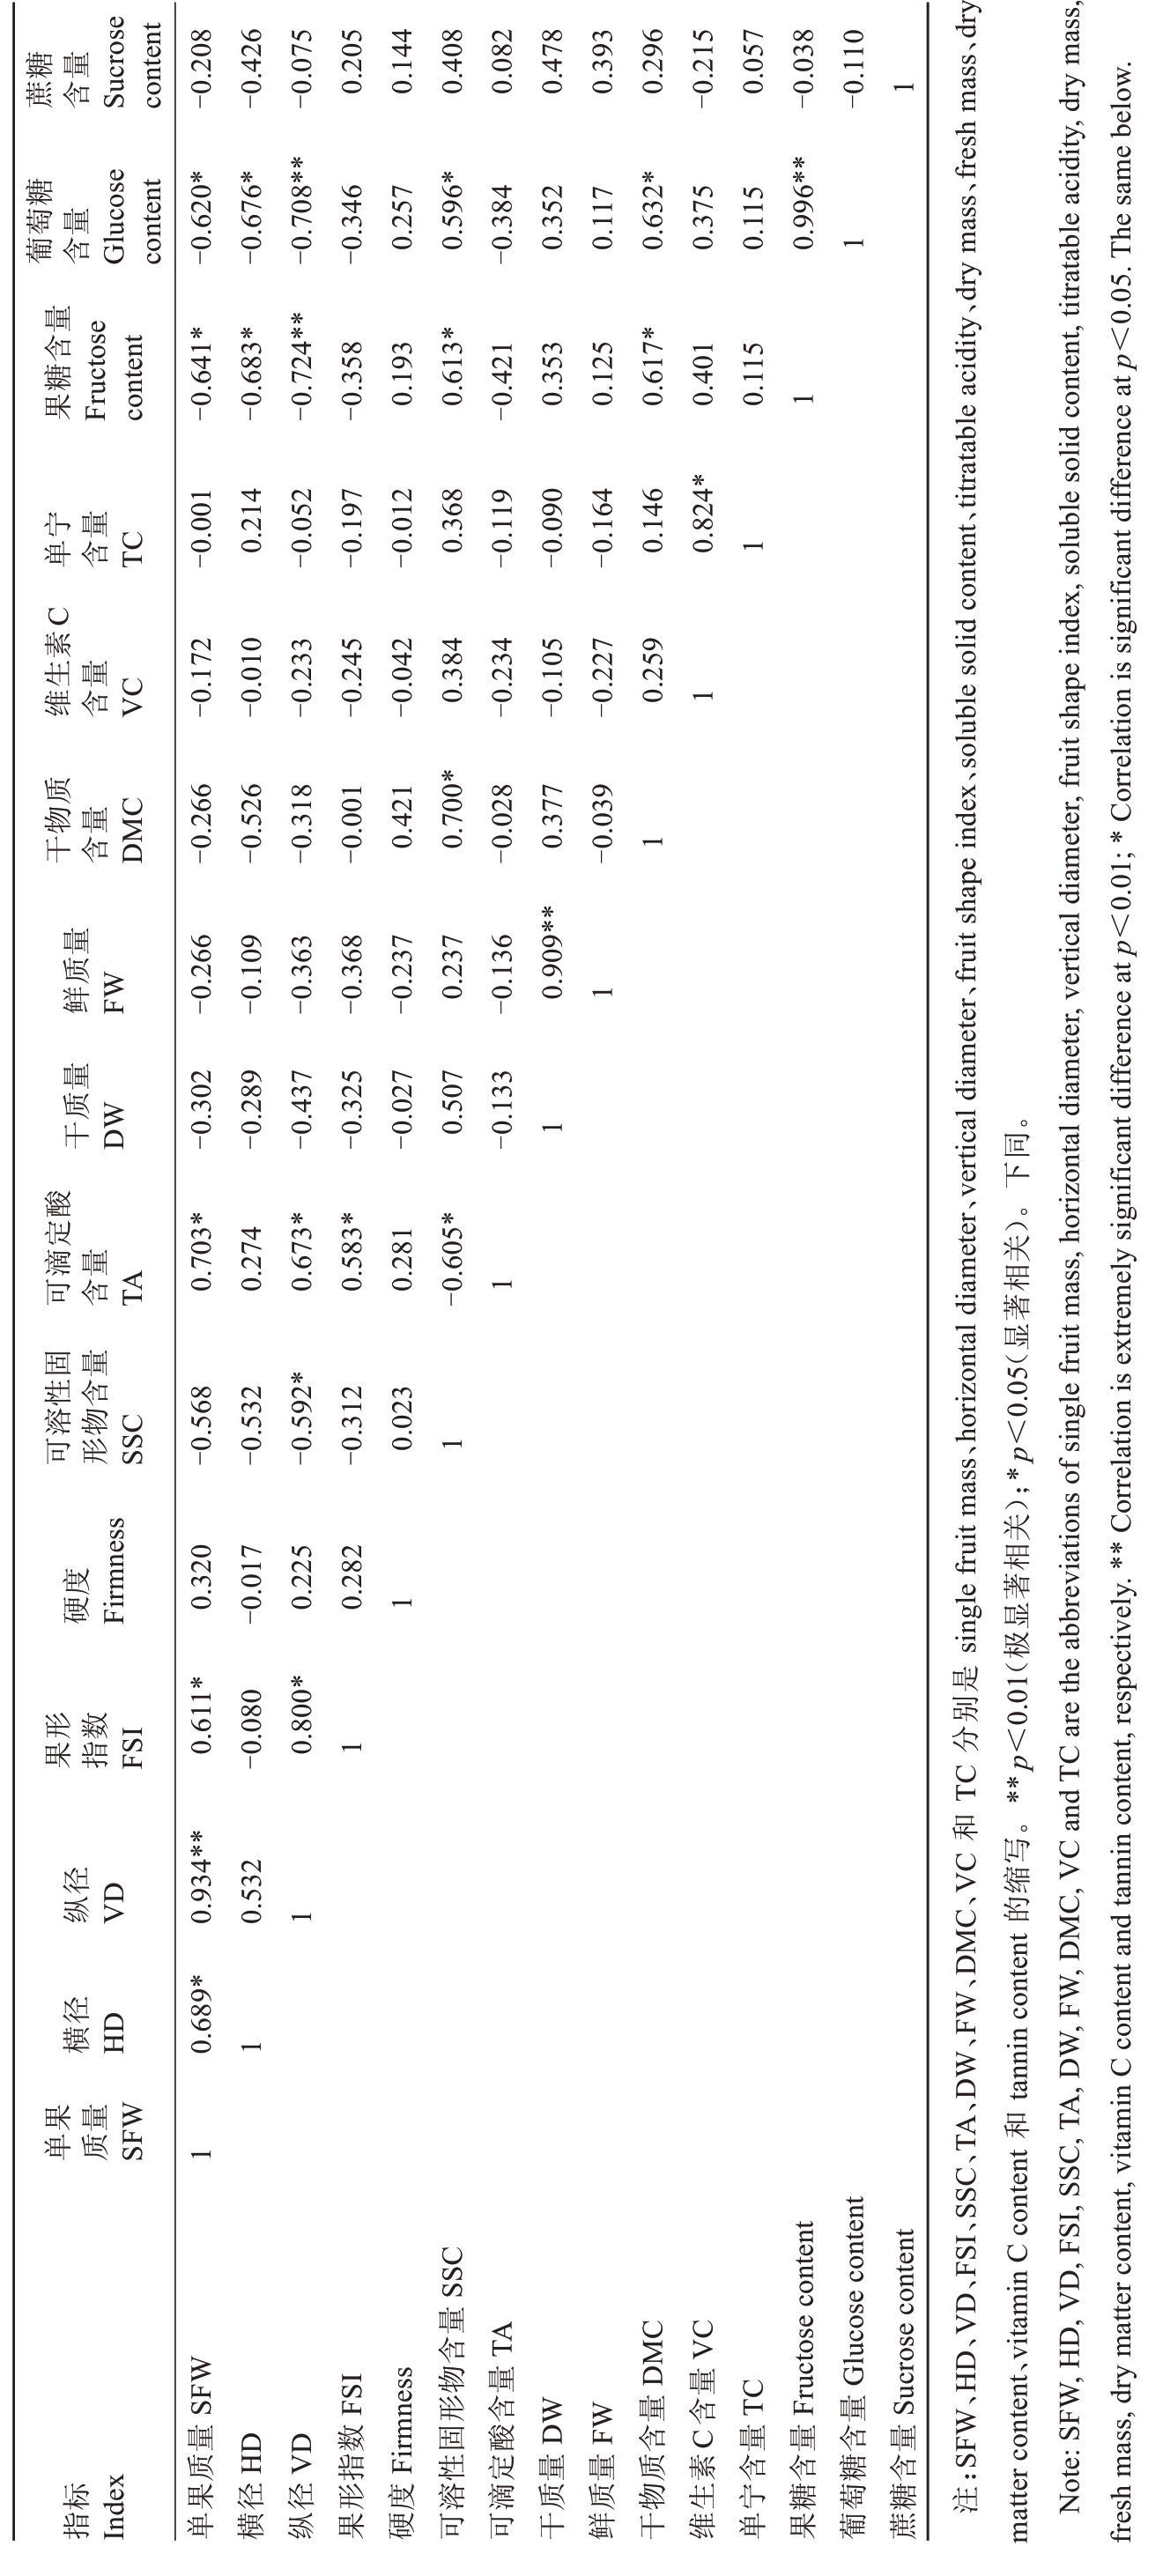
糖量蔗含Sucrose content-0.208-0.426-0.075 0.205 0.144 0.408 0.082 0.478 0.393 0.296-0.215 0.057-0.038-0.110 1糖萄量葡含Glucose content-0.620*-0.676*-0.708**-0.346 0.257 0.596*-0.384 0.352 0.117 0.632*0.375 0.115 0.996**1果Fructose 量含糖content-0.641*-0.683*-0.724**-0.358 0.193 0.613*-0.421 0.353 0.125 0.617*0.401 0.115 1宁量单含TC-0.001 0.214-0.052-0.197-0.012 0.368-0.119-0.090-0.164 0.146 0.824*1 C素生量维含VC-0.172-0.010-0.233-0.245-0.042 0.384-0.234-0.105-0.227 0.259 1质干含DMC-0.266-0.526物量-0.318-0.001 0.421 0.700*-0.028 0.377-0.039 1-0.363鲜FW-0.266量质-0.368-0.109-0.237 0.237-0.136 0.909**1量质0.507 1干DW-0.302-0.289-0.437-0.325-0.027-0.133酸定滴量可含TA0.703*0.274 0.673*0.583*0.281-0.605*1固量性含可形SSC-0.568溶物-0.532-0.592*-0.312 0.023 1硬Firmness度0.320-0.017 0.225 0.282 1形数果指FSI0.611*-0.080 0.800*1纵VD0.934**径0.532 1横HD0.689*径1单质SFW 果量1 SSC量SFW FSI含TA Firmness VC物量DMC Glucose content形含量量TC Fructosecontent量Sucrose content量数固酸DW FW 含C含量量含量指Index 质HD VD 指性定量量质素含含糖含标果径径形度溶滴质质物生宁糖萄糖单横纵果硬可可干鲜干维单果葡蔗singlefruitmass、horizontaldiameter、verticaldiameter、fruit shapeindex、solublesolidcontent、titratable acidity、drymass、fresh mass、dry是别TC 分:SFW、HD、VD、FSI、SSC、TA、DW、FW、DMC、VC 和注。同下)。关相著显关);*p<0.05(相著显极。**p<0.01(写缩tannincontent 的mattercontent、vitaminCcontent 和Note:SFW,HD,VD,FSI,SSC,TA,DW,FW,DMC,VCandTC aretheabbreviationsof single fruitmass,horizontaldiameter,verticaldiameter,fruit shapeindex,solublesolidcontent,titratable acidity,drymass fresh mass,dry matter content,vitaminCcontentandtannin content,respectively.**Correlation is extremelysignificantdifference at p<0.01;*Correlationis significantdifference at p<0.05.The same below.
2.4 中猕2号果实品质指标的主成分分析
对15 个中猕2 号果实指标进行主成分分析(表5)。以主成分特征值大于1为标准,共提取到5个主,成分,主成分1的贡献率为39.476%,决定第1主成分大小的主要是可溶性固形物、果糖和葡萄糖含量。相关性分析结果(表4)显示,可溶性固形物、果糖、葡萄糖含量间存在相关关系,可溶性固形物含量与果糖含量的相关系数为0.613*,呈显著相关,可溶性固形物与葡萄糖含量的相关系数为0.596*,呈显著相关,果糖含量与葡萄糖含量的相关系数为0.996**,呈极显著相关,且果糖含量在第1主成分中的权重最高,因此选择果糖含量作为第1主成分的评价指标。主成分2 贡献率为16.258%,决定第2 主成分大小的主要是维生素C含量与单宁含量。相关性分析结果显示(表4),维生素C 含量与单宁含量相关系数为0.824*,呈显著相关,且维生素C含量在第2主成分中的权重最高,因此选择维生素C含量作为第2主成分的评价指标。主成分3 贡献率为15.739%,决定第3主成分大小的主要是硬度。主成分4 贡献率为10.419%,决定第4 主成分大小的主要是单宁含量。主成分5贡献率为7.250%,决定第5主成分大小的主要是硬度和横径,硬度是第3 主成分的主要评价指标,因此,选择横径作为第5主成分的评价指标。第1主成分、第2 主成分和第4 主成分代表果实内在品质,第3主成分和第5主成分代表果实外在品质。
表5 15 项指标的主成分分析结果
Table 5 Principal component analysis of 15 indicators

注:PC 是principal component 的缩写。
Note:PC is the abbreviations of principal component.
指标Index单果质量SFW横径HD纵径VD果形指数FSI硬度Firmness可溶性固形物含量SSC可滴定酸含量TA干质量DW鲜质量FW干物质含量DMC维生素C含量VC单宁含量TC果糖含量Fructose content葡萄糖含量Glucose content蔗糖含量Sucrose content特征值Characteristic value方差贡献率Variance contribution rate/%累积方差贡献率Cumulative variance contribution rate/%主成分1 PC1-0.144-0.116-0.153-0.097-0.008 0.140-0.108 0.095 0.062 0.099 0.060 0.030 0.146 0.143 0.040 5.921 39.476特征向量Eigenvalues-0.06-0.05-0.06-0.04 0.00 0.06-0.04 0.04 0.03 0.04 0.02 0.01 0.06 0.06 0.02主成分2 PC2 0.024 0.092 0.007-0.047 0.033 0.022-0.069-0.257-0.291 0.028 0.320 0.269 0.080 0.075-0.231 2.439 16.258特征向量Eigenvalues 0.02 0.06 0.00-0.03 0.02 0.01-0.04-0.16-0.19 0.02 0.20 0.17 0.05 0.05-0.15主成分3 PC3 0.127-0.155 0.137 0.273 0.315 0.082 0.196 0.011-0.121 0.286 0.007 0.007 0.100 0.118 0.159 2.361 15.739特征向量Eigenvalues 0.08-0.10 0.09 0.18 0.21 0.05 0.13 0.01-0.08 0.19 0.00 0.00 0.07 0.08 0.10主成分4 PC4 0.158 0.244 0.093-0.065-0.027 0.191 0.076 0.266 0.250 0.055 0.243 0.436-0.153-0.151 0.259 1.563 10.419特征向量Eigenvalues 0.13 0.20 0.07-0.05-0.02 0.15 0.06 0.21 0.20 0.04 0.19 0.35-0.12-0.12 0.21主成分5 PC5 0.243 0.342-0.051-0.307 0.370-0.204 0.192 0.269 0.239 0.076-0.023-0.127 0.210 0.232-0.426 1.088 7.250特征向量Eigenvalues 0.23 0.33-0.05-0.29 0.35-0.20 0.18 0.26 0.23 0.07-0.02-0.12 0.20 0.22-0.41 39.476 55.735 71.473 81.892 89.142
2.5 中猕2号果实品质的综合评价体系建立
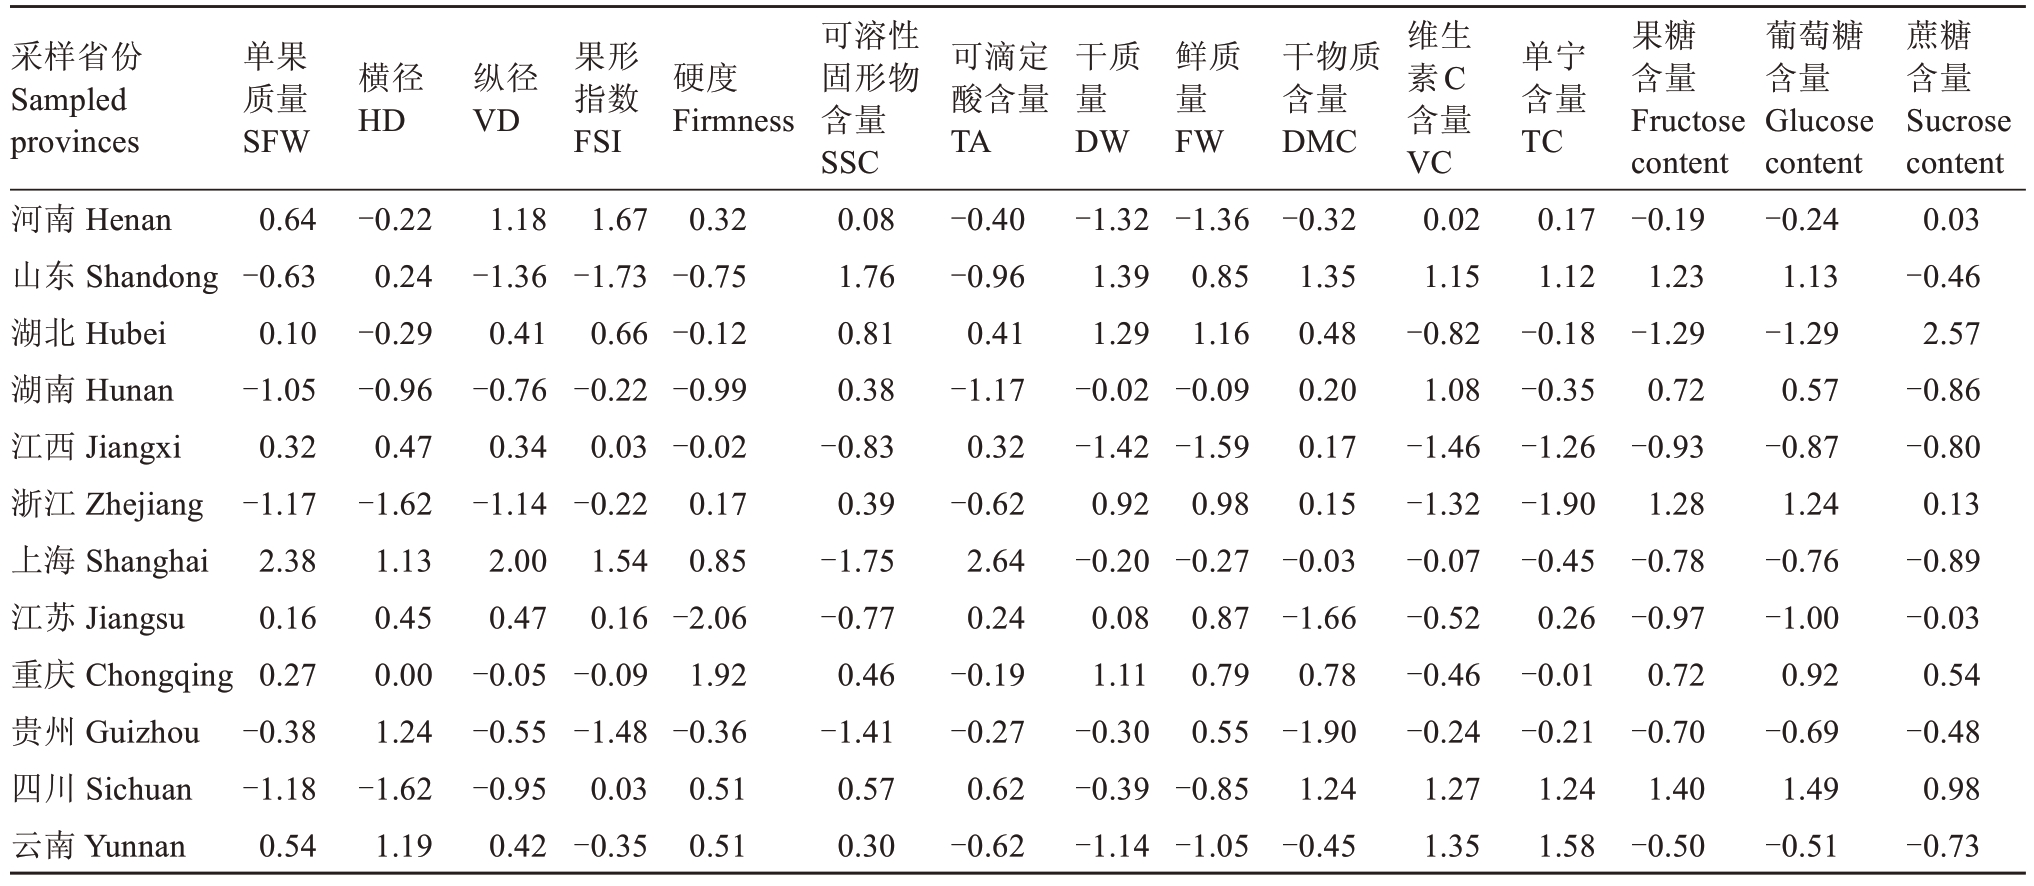
对中猕2号15项果实指标数据进行标准化处理(表6),标准化数据设为X1,……,X15,特征向量与标准化数据乘积后相加得出5 个主成分的得分表达式:
表6 15 项指标数据的标准化
Table 6 Data standardization of 15 indexes
采样省份Sampled provinces河南Henan山东Shandong湖北Hubei湖南Hunan江西Jiangxi浙江Zhejiang上海Shanghai江苏Jiangsu重庆Chongqing贵州Guizhou四川Sichuan云南Yunnan单果质量SFW 0.64-0.63 0.10-1.05 0.32-1.17 2.38 0.16 0.27-0.38-1.18 0.54横径HD纵径VD硬度Firmness-0.22 0.24-0.29-0.96 0.47-1.62 1.13 0.45 0.00 1.24-1.62 1.19 1.18-1.36 0.41-0.76 0.34-1.14 2.00 0.47-0.05-0.55-0.95 0.42果形指数FSI1.67-1.73 0.66-0.22 0.03-0.22 1.54 0.16-0.09-1.48 0.03-0.35 0.32-0.75-0.12-0.99-0.02 0.17 0.85-2.06 1.92-0.36 0.51 0.51可溶性固形物含量SSC 0.08 1.76 0.81 0.38-0.83 0.39-1.75-0.77 0.46-1.41 0.57 0.30可滴定酸含量TA-0.40-0.96 0.41-1.17 0.32-0.62 2.64 0.24-0.19-0.27 0.62-0.62干质量DW-1.32 1.39 1.29-0.02-1.42 0.92-0.20 0.08 1.11-0.30-0.39-1.14鲜质量FW-1.36 0.85 1.16-0.09-1.59 0.98-0.27 0.87 0.79 0.55-0.85-1.05干物质含量DMC-0.32 1.35 0.48 0.20 0.17 0.15-0.03-1.66 0.78-1.90 1.24-0.45维生素C含量VC 0.02 1.15-0.82 1.08-1.46-1.32-0.07-0.52-0.46-0.24 1.27 1.35单宁含量TC 0.17 1.12-0.18-0.35-1.26-1.90-0.45 0.26-0.01-0.21 1.24 1.58果糖含量Fructose content-0.19 1.23-1.29 0.72-0.93 1.28-0.78-0.97 0.72-0.70 1.40-0.50葡萄糖含量Glucose content-0.24 1.13-1.29 0.57-0.87 1.24-0.76-1.00 0.92-0.69 1.49-0.51蔗糖含量Sucrose content 0.03-0.46 2.57-0.86-0.80 0.13-0.89-0.03 0.54-0.48 0.98-0.73
F1=-0.06X1-0.05X2-0.06X3-0.04X4+0.00X5+0.06X6-0.04X7+0.04X8+0.03X9+0.04X10+0.02X11+0.01X12+0.06X13+0.06X14+0.02X15;
F2=0.02X1+0.06X2+0.00X3-0.03X4+0.02X5+0.01X6-0.04X7-0.16X8-0.19X9+0.02X10+0.02X11+0.17X12+0.05X13+0.05X14-0.15X15;
F3=0.08X1-0.10X2+0.09X3+0.18X4+0.21X5+0.05X6+0.13X7+0.01X8-0.08X9+0.19X10+0.00X11+0.00X12+0.07X13+0.08X14+0.10X15;
F4=0.13X1+0.20X2+0.07X3-0.05X4-0.02X5+0.15X6+0.06X7+0.21X8+0.20X9+0.04X10+0.19X11+0.35X12-0.12X13-0.12X14+0.21X15;
F5=0.23X1+0.33X2-0.05X3-0.29X4+0.35X5-0.20X6+0.18X7+0.26X8+0.23X9+0.07X10-0.02X11-0.12X12+0.20X13+0.22X14-0.41X15。
以主成分方差贡献率为权数,建立果实品质综合评价方程:
F 综=0.395F1+0.163F2+0.157F3+0.104F4+0.725F5。
基于此方程计算出12个省份中猕2号果实品质的综合得分,综合得分越高,表明该区域的中猕2 号综合品质越好(表7),因此,中国不同地区中猕2 号综合排序为:重庆、山东、上海、贵州、浙江、云南、四川、湖南、江西、江苏、河南、湖北。
表7 中国不同地区中猕2 号评价得分
Table 7 Assessment scores of Zhongmi No.2 fruits in different regions of China
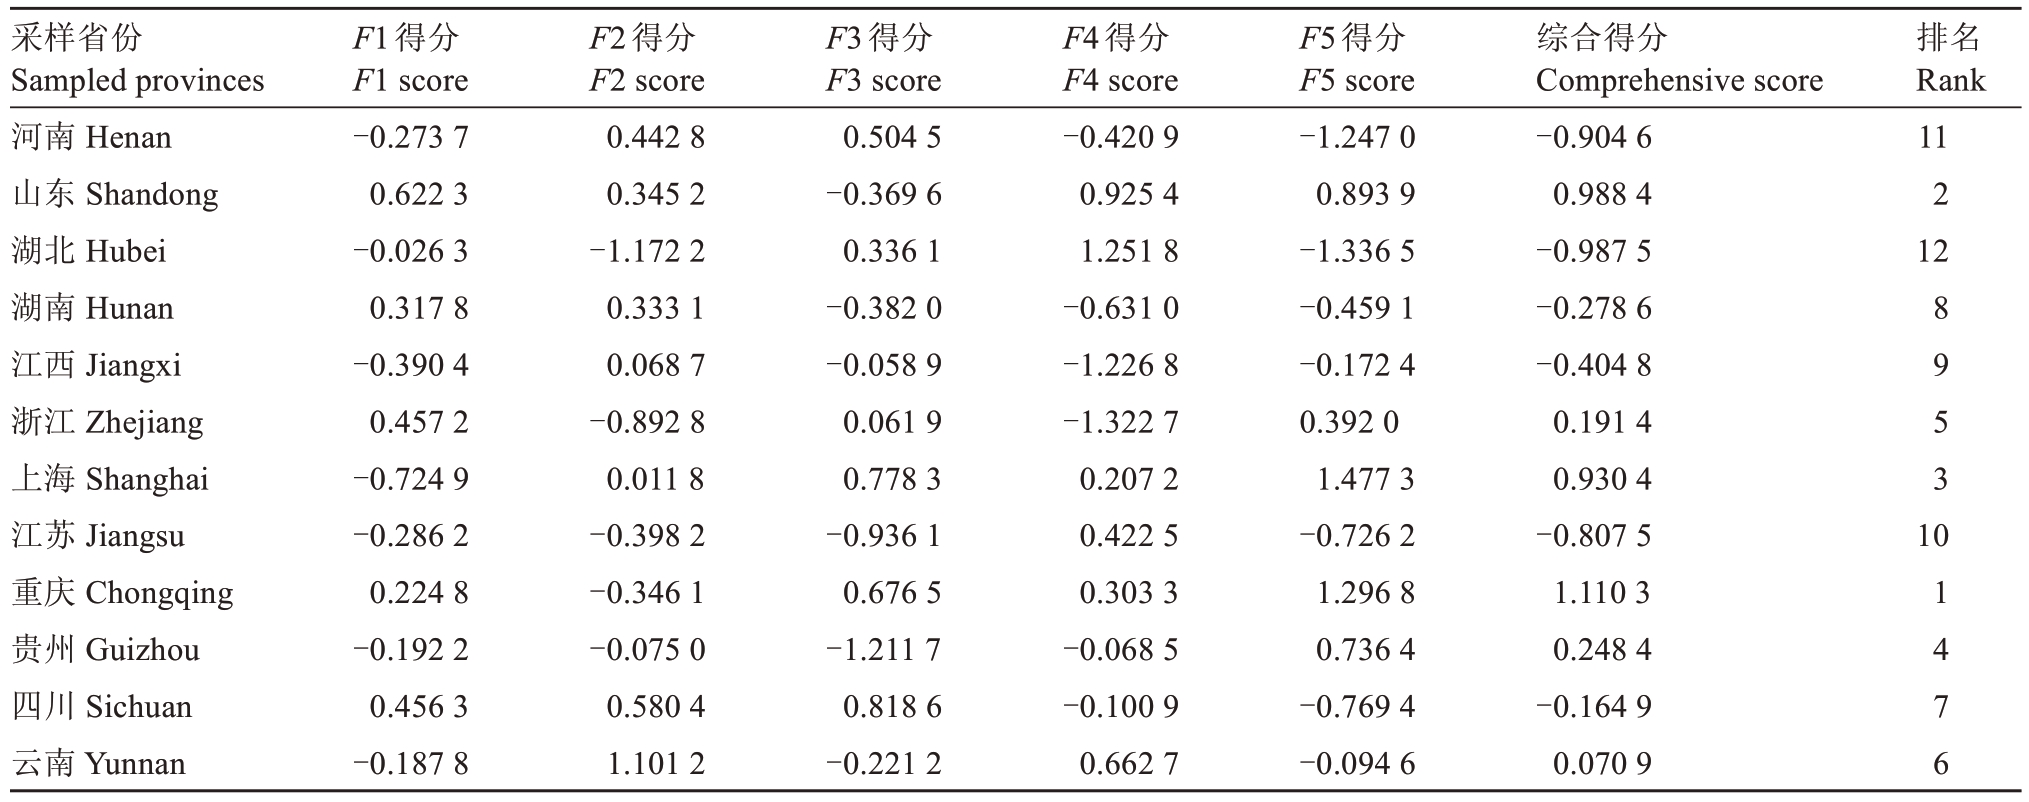
采样省份Sampled provinces河南Henan山东Shandong湖北Hubei湖南Hunan江西Jiangxi浙江Zhejiang上海Shanghai江苏Jiangsu重庆Chongqing贵州Guizhou四川Sichuan云南Yunnan F1得分F1 score-0.273 7 0.622 3-0.026 3 0.317 8-0.390 4 0.457 2-0.724 9-0.286 2 0.224 8-0.192 2 0.456 3-0.187 8 F2得分F2 score 0.442 8 0.345 2-1.172 2 0.333 1 0.068 7-0.892 8 0.011 8-0.398 2-0.346 1-0.075 0 0.580 4 1.101 2 F3得分F3 score 0.504 5-0.369 6 0.336 1-0.382 0-0.058 9 0.061 9 0.778 3-0.936 1 0.676 5-1.211 7 0.818 6-0.221 2 F4得分F4 score-0.420 9 0.925 4 1.251 8-0.631 0-1.226 8-1.322 7 0.207 2 0.422 5 0.303 3-0.068 5-0.100 9 0.662 7 F5得分F5 score-1.247 0 0.893 9-1.336 5-0.459 1-0.172 4 0.392 0 1.477 3-0.726 2 1.296 8 0.736 4-0.769 4-0.094 6综合得分Comprehensive score-0.904 6 0.988 4-0.987 5-0.278 6-0.404 8 0.191 4 0.930 4-0.807 5 1.110 3 0.248 4-0.164 9 0.070 9排名Rank 11 2 12 8 9 5 3 10 1 4 7 6
3 讨 论
果实综合品质受到外观品质和内在品质的共同影响,品质优劣决定其商品价值与最终生产效益的高低[15-17]。中猕2 号是中国农业科学院郑州果树研究所选育的优良新品种[18],表现大果、高糖、强抗性,综合品质好,在全国猕猴桃品鉴会上获得金奖,有较好的发展潜力,目前已经在全国多个省份引种栽培。为了明确中猕2 号在各个区域的推广潜力,笔者在本研究中选取中国12 个省份的中猕2 号果实,进行果实外观品质和内在品质指标检测,利用主成分分析将多个品质指标进行线性变换提取综合因子,最终提取到横径与硬度作为外观综合因子,果糖、维生素C 和单宁含量作为内在品质综合因子。赵琼玲等[19]利用主成分分析提取果实横径和维生素C 含量作为余甘子果实品质综合因子,表明果实横径和维生素C含量可作为品质因子用于综合评价。
在本研究中,通过拟定果实品质综合评价方程,建立中猕2 号综合评价体系。重庆、山东和上海的中猕2 号综合品质排名位列前三,三个地区经纬度均不同,分别代表中国不同生态区域,中猕2号在这三个区域的综合表现优良,表明中猕2 号能够适应这12 个区域或类似气候区域的生态条件,具有较大的推广潜力,可以在这12 个生态区域或类似气候区域内推广种植。笔者在本研究中从中国不同地区采集中猕2 号果实样品,利用多种分析方法建立了品质综合评价体系,为品种推广奠定了基础。果实品质易受环境因子影响,中国具有丰富的地理多态性,不同经纬度和海拔能够对果实品质产生影响,因此,后续应根据不同经纬度和海拔增加采样点,并对不同年份间的数据进行对比和分析,更全面地反映中猕2 号对不同生态区域的适应能力,为品种区划提供指导。
4 结 论
通过测定中国不同地区中猕2 号果实品质指标,利用相关性分析和主成分分析建立了品质综合评价体系,对不同地区果实进行综合评价,筛选出横径、硬度以及果糖、维生素C 和单宁含量作为中猕2号果实品质性状评价的核心指标,对不同地区果实品质进行排序,最终得出结论:中猕2 号适应性强,能够在不同生态区内推广种植。
[1] 方金豹,钟彩虹.新中国果树科学研究70 年:猕猴桃[J].果树学报,2019,36(10):1352-1359.FANG Jinbao,ZHONG Caihong.Fruit scientific research in New China in the past 70 years:Kiwifruit[J].Journal of Fruit Science,2019,36(10):1352-1359.
[2] 陈璐,王小玲,毛积鹏,林孟飞,卢玉鹏,公旭晨,高柱.不同黄肉猕猴桃品种果实发育动态变化及品质综合评价[J].经济林研究,2024,42(1):220-231.CHEN Lu,WANG Xiaoling,MAO Jipeng,LIN Mengfei,LU Yupeng,GONG Xuchen,GAO Zhu.Dynamic changes of fruit development and comprehensive quality evaluation of different yellow-flesh kiwifruit cultivars[J].Non-wood Forest Research,2024,42(1):220-231.
[3] 温锦丽,曹炜玉,王月,何艳丽,孙怡宁,原鹏强,孙博位,路文鹏.基于主成分分析与聚类分析的软枣猕猴桃果实品质综合评价[J].食品工业科技,2024,45(1):247-257.WEN Jinli,CAO Weiyu,WANG Yue,HE Yanli,SUN Yining,YUAN Pengqiang,SUN Bowei,LU Wenpeng.Comprehensive evaluation of fruit quality of Actinidia arguta based on principal component analysis and cluster analysis[J].Science and Technology of Food Industry,2024,45(1):247-257.
[4] 匡立学,聂继云,李银萍,程杨,沈友明.中国不同地区‘富士’苹果品质评价[J].中国农业科学,2020,53(11):2253-2263.KUANG Lixue,NIE Jiyun,LIYinping,CHENG Yang,SHEN Youming.Quality evaluation of‘Fuji’apples cultivated in different regions of China[J].Scientia Agricultura Sinica,2020,53(11):2253-2263.
[5] 赵双,黄颖宏,郄红丽.30 个杨梅品种果实品质分析与综合评价[J].果树学报,2024,41(3):392-402.ZHAO Shuang,HUANG Yinghong,QIHongli.Fruit quality analysis and comprehensive evaluation of 30 bayberry varieties[J].Journal of Fruit Science,2024,41(3):392-402.
[6] 张金龙.浅析猕猴桃栽培管理技术[J].园艺与种苗,2023,43(9):42-43.ZHANG Jinlong.Analysis of kiwifruit cultivation management technology[J].Horticulture&Seed,2023,43(9):42-43.
[7] 蔡雪健.贵长猕猴桃栽培管理技术[J].农业技术与装备,2023(1):177-179.CAI Xuejian.Cultivation and management techniques of Guichang kiwi fruit[J].Agricultural Technology & Equipment,2023(1):177-179.
[8] 高欢,肖委明,廖光联,黄春辉,贾东峰,李芸,宋明昌,黄鹃,徐小彪.毛花猕猴桃新品种‘赣绿1 号’的生物学特性及关键栽培技术[J].中国南方果树,2024,53(1):179-184.GAO Huan,XIAO Weiming,LIAO Guanglian,HUANG Chunhui,JIA Dongfeng,LIYun,SONG Mingchang,HUANG Juan,XU Xiaobiao.Biological characteristics and cultivation techniques of new Actinidia eriantha cultivar Ganlü No.1[J].South China Fruits,2024,53(1):179-184.
[9] 廖钦洪,张文林,兰建彬,李哲馨,唐建民,彭文平.重庆市不同区县‘红阳’猕猴桃果实品质综合评价[J].经济林研究,2021,39(1):17-23.LIAO Qinhong,ZHANG Wenlin,LAN Jianbin,LI Zhexin,TANG Jianmin,PENG Wenping.Comprehensive evaluation of fruit quality of‘Hongyang’kiwifruit in different regions of Chongqing[J].Non-wood Forest Research,2021,39(1):17-23.
[10] 江海,陈小华,杜佳宝,杨清云.基于主成分分析评价陕南地区主栽猕猴桃的品质[J].陕西理工大学学报(自然科学版),2021,37(1):43-49.JIANG Hai,CHEN Xiaohua,DU Jiabao,YANG Qingyun.Principal component analysis of quality indexes of main kiwifruit cultivars planted in southern Shaanxi[J].Journal of Shaanxi University of Technology (Natural Science Edition),2021,37(1):43-49.
[11] 沈川,李夏.秦巴山区20 份野生美味猕猴桃果实品质分析与综合评价[J].西北农业学报,2023,32(2):282-289.SHEN Chuan,LIXia.Quality analysis and comprehensive evaluation of 20 wild kiwi fruit in Qinba mountains[J].Acta Agriculturae Boreali-occidentalis Sinica,2023,32(2):282-289.
[12] 刘科鹏,黄春辉,冷建华,陈葵,严玉平,辜青青,徐小彪.‘金魁’猕猴桃果实品质的主成分分析与综合评价[J].果树学报,2012,29(5):867-871.LIU Kepeng,HUANG Chunhui,LENG Jianhua,CHEN Kui,YAN Yuping,GU Qingqing,XU Xiaobiao.Principal component analysis and comprehensive evaluation of the fruit quality of‘Jinkui’kiwifruit[J].Journal of Fruit Science,2012,29(5):867-871.
[13] 中华人民共和国国家卫生和计划生育委员会.食品安全国家标准食品中抗坏血酸的测定:GB 5009.86—2016[S].北京:中国标准出版社,2017.National Health and Family Planning Commission of the People’s Republic of China.National food safety standard-Determination of ascorbic acid in foods:GB 5009.86—2016[S].Beijing:Standards Press of China,2017.
[14] 中华人民共和国农业部.水果、蔬菜及其制品中单宁含量的测定分光光度法:NY/T 1600—2008[S].北京:中国农业出版社,2008.Ministry of Agriculture of the People’s Republic of China.Determination of tannin content in fruit,vegetable and derived product-Spectrophotometry method:NY/T 1600—2008[S].Beijing:China Agriculture Press,2008.
[15] 林媚,吴韶辉.浙江省12 个柑橘品种果实品质分析与评价[J].浙江农业科学,2019,60(6):963-966.LIN Mei,WU Shaohui.Analysis and evaluation on fruit quality of 12 citrus varieties[J].Journal of Zhejiang Agricultural Sciences,2019,60(6):963-966.
[16] 王思威,孙海滨,常虹,钟声,赵俊生,王潇楠.基于主成分分析综合评价白糖罂荔枝果实品质[J].果树学报,2022,39(4):610-620.WANG Siwei,SUN Haibin,CHANG Hong,ZHONG Sheng,ZHAO Junsheng,WANG Xiaonan.Comprehensive evaluation of fruit quality of Baitangying litchi based on principal component analysis[J].Journal of Fruit Science,2022,39(4):610-620.
[17] 朴哲虎,石岩,程金良,刘冰雁,杨林先,李雄.苹果梨果实矿质元素含量与品质的相关性分析[J].安徽农业科学,2018,46(20):159-161.PIAO Zhehu,SHIYan,CHENG Jinliang,LIU Bingyan,YANG Linxian,LIXiong.Correlation analysis of mineral element content and quality of apple pear fruit[J].Journal of Anhui Agricultural Sciences,2018,46(20):159-161.
[18] 齐秀娟,林苗苗,徐善坤,孙雷明,方金豹.美味猕猴桃新品种‘中猕2 号’[J].园艺学报,2015,42(增刊2):2835-2836.QI Xiujuan,LIN Miaomiao,XU Shankun,SUN Leiming,FANG Jinbao.A new cultivar of Actinidia deliciosa‘Zhongmi 2’[J].Acta Horticulturae Sinica,2015,42(Suppl.2):2835-2836.
[19] 赵琼玲,韩学琴,沙毓沧,罗会英,钱坤建,邓红山,金杰.21 份余甘子果实品质性状的分析和评价[J].中国热带农业,2021(6):27-32.ZHAO Qiongling,HAN Xueqin,SHA Yucang,LUO Huiying,QIAN Kunjian,DENG Hongshan,JIN Jie.Analysis and evaluation of the fruit quality characters of 21 Phyllanthus emblica L.[J].China Tropical Agriculture,2021(6):27-32.