核桃(Juglans regia L.)又名胡桃、羌桃,原产于中国、印度和欧洲东南部,属胡桃科,是世界上消费量最大的坚果之一。果仁富含矿质元素、蛋白质、脂肪等[1],具有较高的营养价值和保健价值,对肺癌、乳腺癌等疾病有着防御的作用[2-4]。其中,蛋白质含量是评价核桃品质的重要指标,目前测定蛋白质含量的常用方法有考马斯亮蓝法、凯氏定氮法以及双缩脲法[5-7]。用这些传统方法测定的化学值精确度高,结果可靠[8-9];但分析过程既费时又费力,并且使用的化学试剂会对测试人员身体有害[10]。因此,利用近红外光谱技术建立一种快速、通用、高效的方法来预测核桃蛋白质含量是迅速辨别核桃品质的关键。
近红外光谱技术(NIRS)因具有客观、快速和经济的特性而受到越来越多的关注[11],且具有操作简单、快速、环保等优点,可用于检测同种物质中的多种成分。具有灵敏度和分辨率高、扫描速度快等显著优点,广泛应用于农业、医药、烟草、石油化工[12-14]等领域,可以胜任含量相对较低以及结构相似的化学组分的分析。例如,王纯阳等[15]利用偏最小二乘建模方法实现了水稻蛋白质含量的测定。王丽萍等[16]开展了大豆中蛋白质和脂肪含量的近红外反射光谱预测建模研究。在坚果检测方面,对蛋白质含量的近红外光谱模型预测研究已在松子、花生、板栗等[17]中报道,而对磨碎的核桃仁可溶性蛋白质含量的近红外光谱检测研究报道较少。本试验中在4000~10 000 cm-1范围内采集核桃碎仁的光谱信息,建立核桃仁蛋白质含量的预测模型,筛选适合于核桃仁中可溶性蛋白质含量的预处理方法[18],以期找出核桃仁可溶性蛋白质含量快速检测的最优模型组合方式。
1 材料和方法
1.1 材料与仪器设备
为了得到比较准确的光谱信息,解决核桃有硬壳包裹以及核桃整仁的凹凸现象造成光谱反射不均一的问题,采用破损法对核桃仁进行处理。采用傅里叶近红外光谱仪(Antaris-Ⅱ型,美国)扫描光谱,分辨率为8 cm-1,增益为2x,以仪器内置背景为参比,扫描32 次获得平均光谱。样品选自新疆阿克苏地区温宿县核桃林场的温185 核桃,分别来自9 个不同核桃园(高产管理果园、中产管理果园、低产管理果园各3个)的180份核桃样品,每个核桃园的核桃树株行距为4 m×6 m,树龄10 年生。在核桃成熟期(2021-09-01)开始采收,采收完成后去青皮置于通风处晾干,含水量在6%左右。晾干后对核桃进行破壳取仁,使用FW-80 型高速万能粉碎机将核桃仁粉碎3 min 混合均匀后装在塑料袋中,密封并储存在4 ℃,直到进行光谱扫描和蛋白质含量的测定。
1.2 核桃仁原始光谱的采集
采集光谱前,将试验样本置于仪器所在的房间内,保证所有样品光谱采集条件的一致性[19-20]。采集光谱时,仪器需开机预热60 min,在4000~10 000 cm-1的范围内收集核桃仁光谱。将粉碎后的核桃仁填充于石英样品杯中(直径30 mm,高为5 mm,壁厚1 mm)与杯口平行,每次装满样品后将其表面压至水平后可进行光谱的采集。每个样品扫描3次之后得到540 条光谱,求取光谱平均值,得到180 条光谱作为该样品的最终光谱。每次测量后,应先用自来水冲洗样品杯,再用蒸馏水清洗,最后用乙醇擦拭干净,以进行下一个样品的光谱采集。
1.3 核桃仁可溶性蛋白质含量的测定
光谱采集完成后,参考李合生[21]的方法,在595 nm的波长下比色,取其平均值作为最后的可溶性蛋白质含量值。根据以下公式可算出蛋白质含量。
式中,X1表示可溶性蛋白质含量(mg·g-1);C 表示根据标准曲线查得牛血清蛋白质含量(μg);V1表示试样提取液总体积(mL);V2表示测定时吸取的上清液体积(mL);M 表示称取的核桃仁样品的质量(g);N表示稀释倍数;1000表示换算系数。
1.4 光谱预处理方法
样品的近红外光谱图通过导数处理,可减轻背景的干扰以及分辨一些重叠在一起的峰[22]。光散射校正主要针对漫反射数据采集过程中因样品粒径大小分布不均匀导致的光谱差异[23]。本试验中对光谱进行预处理的方法有6种,分别是一阶导数(FD)、二阶导数(SD)、S-G 平滑+二阶导数、多元散射校正(MSC)、多元散射校正+一阶导数、标准正态变量变换(SNV)+二阶导数。
1.5 数据处理
利用MATLAB R2017a 软件对光谱信息进行预处理、提取特征波段等,最后建立近红外光谱与化学含量之间的数学模型,使用Excel 2021 进行化学值和光谱均值计算,同时采用Origin 2021绘图。
2 结果与分析
2.1 核桃仁可溶性蛋白质含量分析
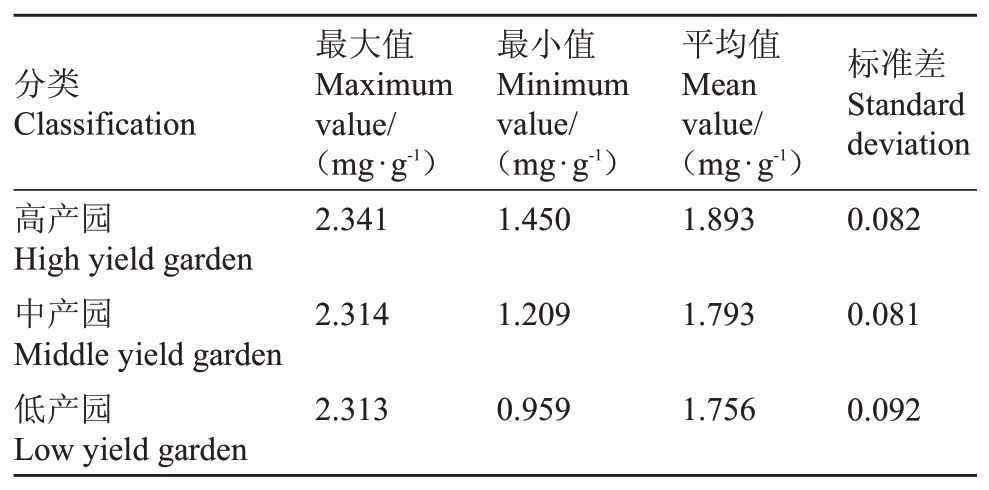
通过公式可算出核桃仁中可溶性蛋白质含量,从结果可知,每个样品的可溶性蛋白质含量有较大差异,具有很强的差异性和代表性。表1 为不同管理模式下果园样品数据差异比较结果,从表中可以看出,不同管理模式下,果园中可溶性蛋白质含量的平均值具有一定的差异,利于模型建立。
表1 不同管理模式下可溶性蛋白质含量数据
Table 1 Soluble protein content data in different management modes
?
2.2 核桃仁近红外光谱分析
近红外光谱的吸收谱带主要是由有机物分子中不同基团及化学键的振动引起的[24],核桃仁主要由蛋白质、脂肪、糖类和微量元素组成。由图1 可知,核桃仁光谱在4000~10 000 cm-1之间有明显的吸收峰,特征谱区波数9075~9450 cm-1区域对应着蛋白质-RNH2基团的三级倍频;波数6900~7300 cm-1区域对应着蛋白质-CONH2基团的二级倍频;波数5640~5880 cm-1区域对应着蛋白质-CH和-CH2基团的一级倍频,波数4220~4370 cm-1区域对应着蛋白质-CH、-CH2和-CH3基团的组合频。虽然在不同管理水平下的不同样品原始吸收光谱形状基本一致,但是每条谱线所对应的反射强度存在一定的差异,有利于建模。

图1 温185 核桃仁原始光谱
Fig.1 Raw spectra of the Wen 185 walnut kernel
2.3 剔除异常样本
为了使测量误差降到最小甚至消除测量误差造成的影响,提高核桃仁蛋白质含量预测模型的稳定性和精确度[25],本试验中采用了马氏距离法[26]来剔除存在的异常值。通过马氏距离法已剔除5 个异常值,加上同一类数据的自然变异(极端值)的出现影响建模效果,故将其剔除,最终剩余174个样本数据。
2.4 划分样本集结果
试验中经过剔除异常值之后共计174个核桃仁样本,根据SPXY算法,可将校正集与验证集的样本数按3∶1 的比例划分[27]。SPXY 算法是一种基于统计基础的样本集选择方法,用光谱-理化值共生距离作为依据以保证最大程度表征样本分布,提高模型稳定性[28-29]。按照这个比例可把校正集样本数划分成132 个,验证集样本数划分成42 个。以174 组样本的蛋白质及其对应的光谱信息为输入,输出为校正集132 组样本的化学含量值及其对应的光谱信息,以及验证集42组样本的化学含量值及其对应的光谱信息[30-31]。依照SPXY 算法对核桃仁光谱进行样本的划分。从表2 中可以看出,校正集中样品含量的范围大于验证集中样品含量的范围,即验证集的最大值和最小值均在其校正集最大值和最小值范围内,可说明按这种方法来划分校正集样品是合理的。
表2 样本可溶性蛋白质含量统计及样本集划分结果
Table 2 Sample soluble protein content statistics and sample set division results

?
2.5 光谱预处理的选择与特征波长的提取
2.5.1 光谱预处理的选择 采用6种不同组合的预处理方法对光谱进行预处理,预处理之后建立BP神经网络蛋白质含量的预测模型。以校正集和验证集的决定系数R2和均方根的参数来确定光谱的预处理和建模方法,校正均方根误差(RMSEC)和预测均方根误差(RMSEP)越接近0、决定系数R2越接近1,说明相关性显著[32-34]。同时,校正集和验证集的决定系数或RMSEC 和RMSEP 之间差异越小越好,RMSEC和RMSEP 之间差异小表明模型具有很好的鲁棒性。残差预测偏差(RPD)的值越大,表明该模型越能够可靠地预测其化学成分。表3是光谱预处理后的建模结果,从表中可以看出,MSC+FD 组合的预处理方法与其他预处理方法相比,RMSEC和RMSEP 最小,分别为0.089 5 和0.105 9,验证集的决定系数R2为0.825 0,因此筛选出最佳预处理方法是MSC+FD的组合方式。图2是6种预处理后的光谱图与原始光谱图的比较,从比较结果来看,经过MSC+FD预处理组合的数据出现了显著的变化,光谱噪声减小,峰值比原始图中的峰值更清晰。
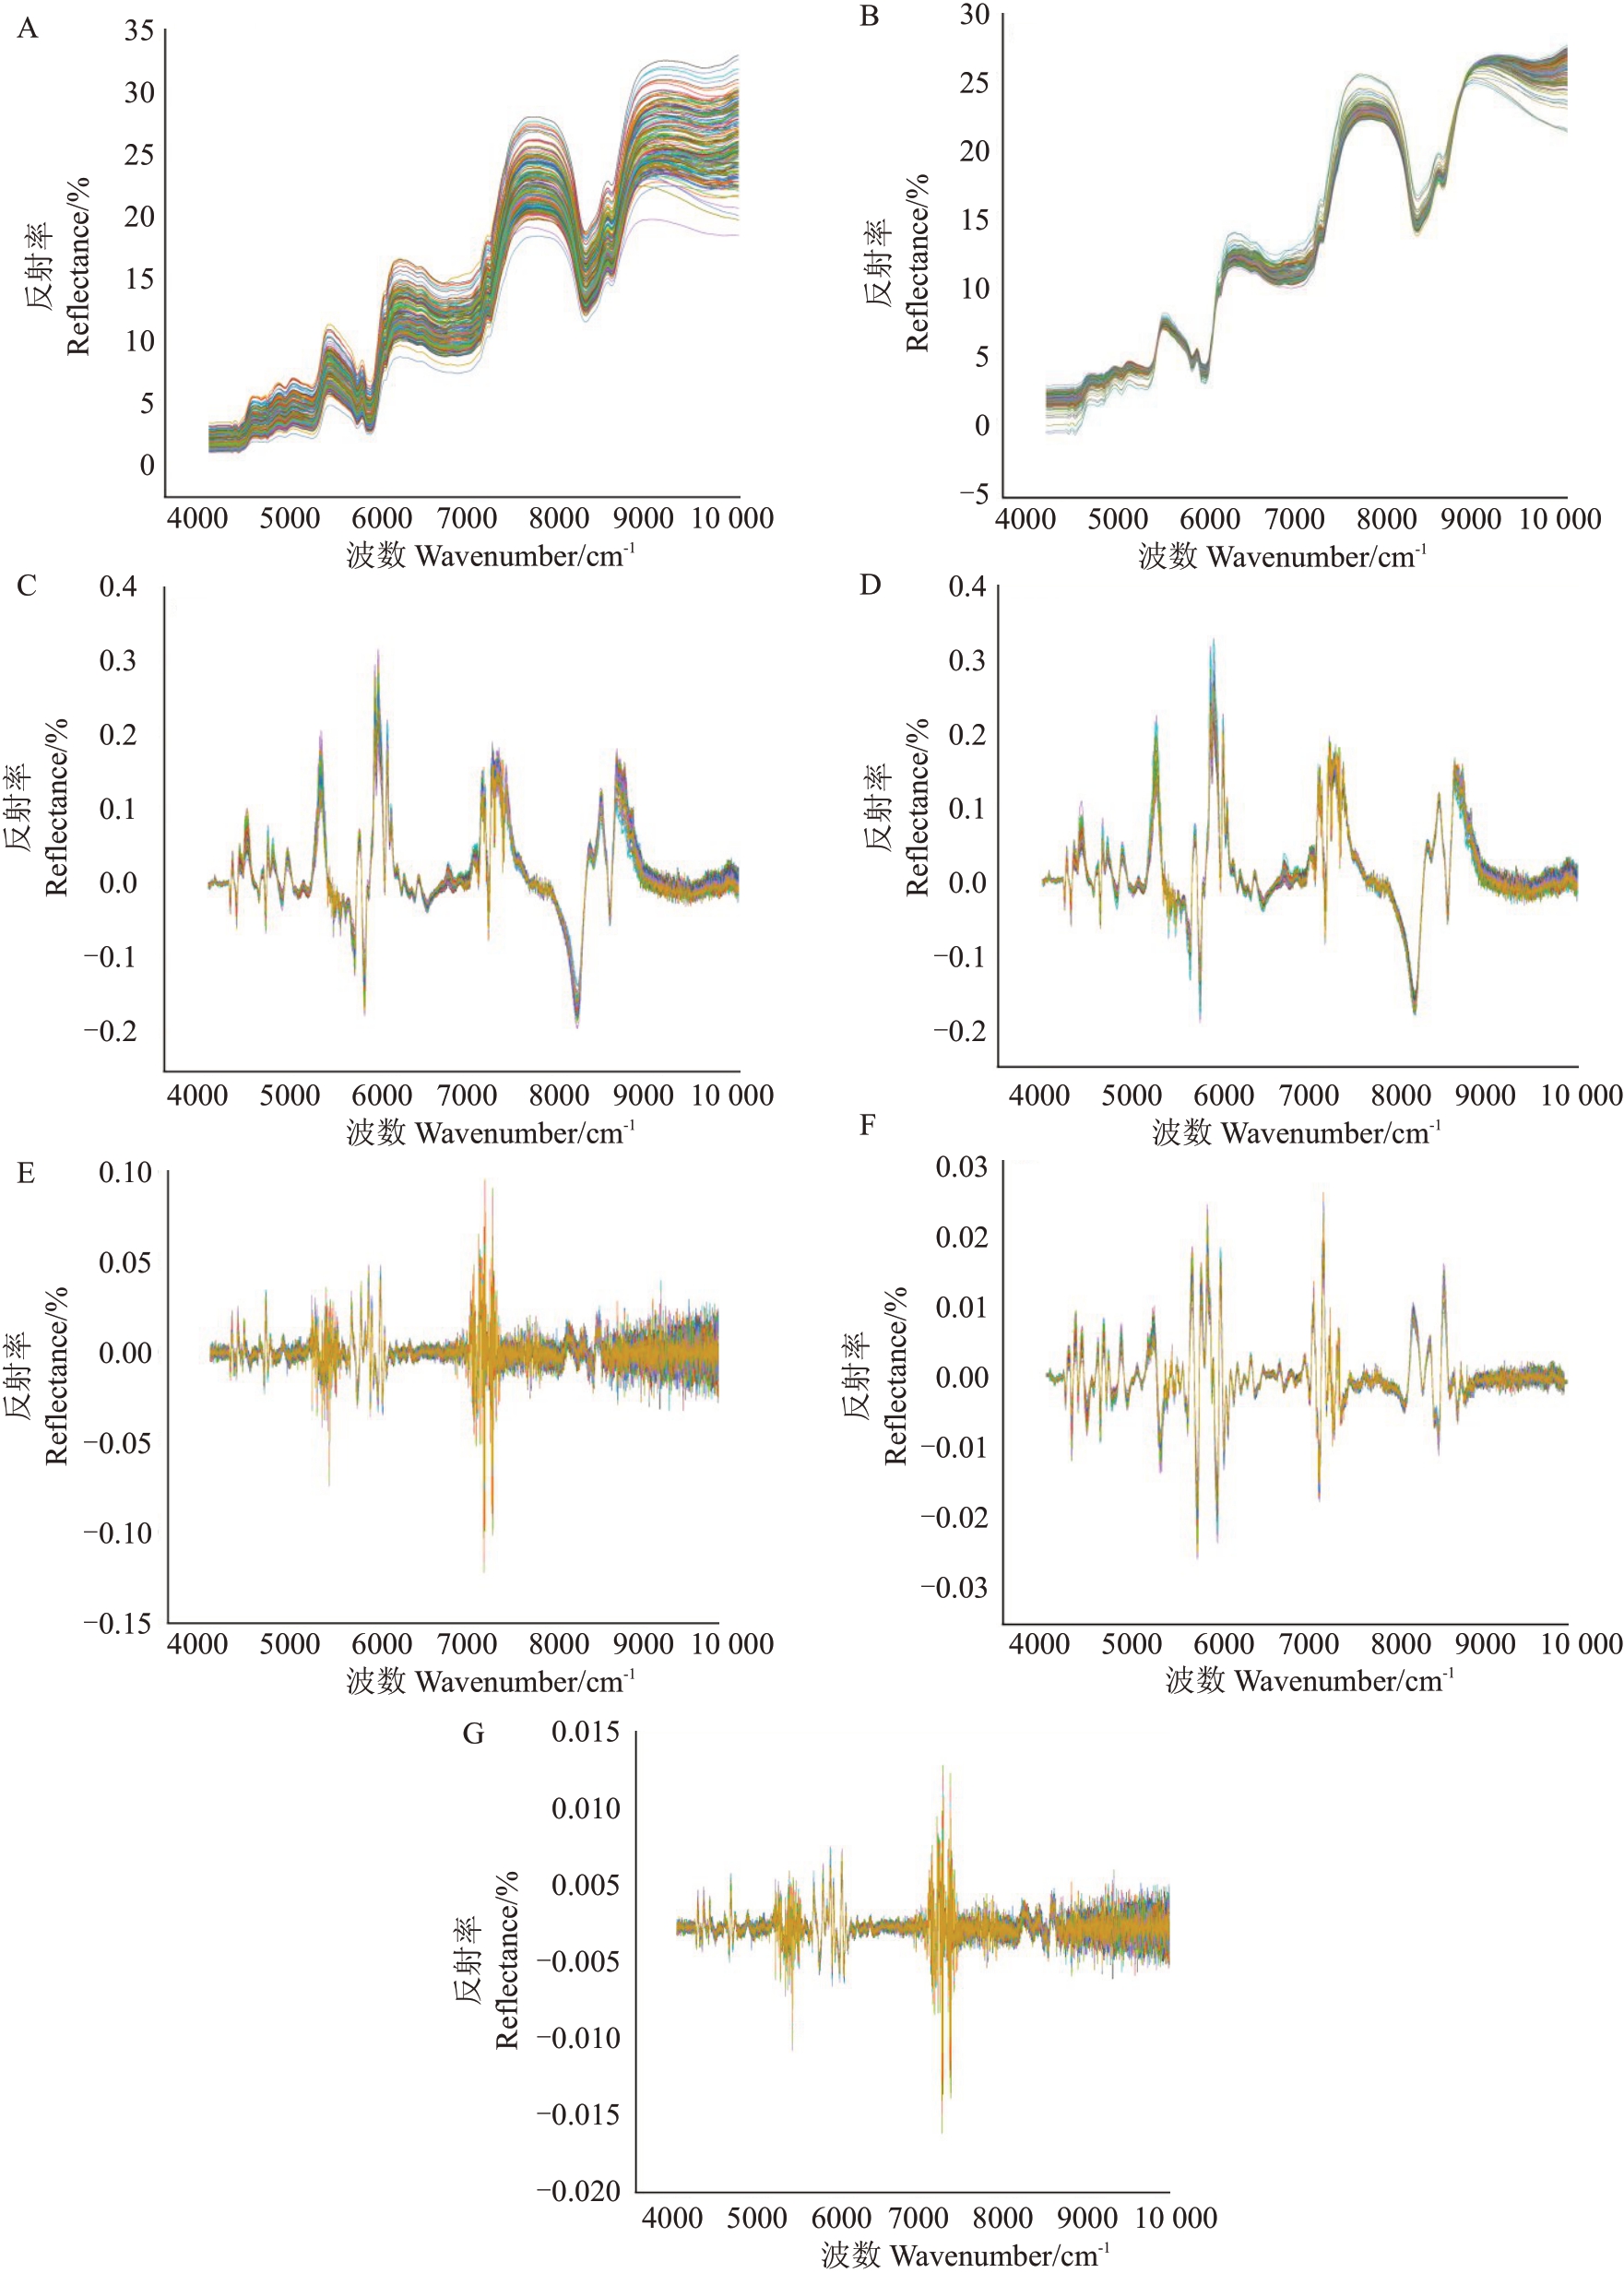
图2 6 种预处理光谱图
Fig.2 6 kinds of preprocessing spectrograms
A.原始光谱图;B.多元散射校正预处理(MSC);C.一阶导数预处理(FD);D.多元散射校正预处理与一阶导数组合预处理(MSC+FD);E.二阶导数(SD);F.卷积平滑与二阶导数组合预处理(SG+SD);G.标准正态变换与二阶导数组合预处理(SNV+SD)。
A.An original spectral;B.The Multivariate scattering correction preprocessing,MSC;C.The First derivative preprocessing,FD;D.The Multivariate scattering correction preprocessing and first derivative combination preprocessing,MSC+FD;E.The Second derivative preprocessing,SD;F.The Combining preprocessing for convolutional smoothing and second derivative,SG+SD;G.The Combining preprocessing for standard normal transformation and second derivative,SNV+SD.
表3 不同预处理方法的建模结果
Table 3 Modeling results of different pretreatment methods

?
2.5.2 特征波长的提取 竞争性自适应重加权算法(CARS)是一种结合蒙特卡洛采样与PLS 模型回归系数的特征变量选择方法,模仿达尔文理论中的“适者生存”的原则[35-37]。图3表示运用CARS算法挑选特征波长结果图[38]。其中,图3-A 表示变量数量变化趋势,图3-B表示RMSECV值变化趋势,图3-C表示每个变量回归系数值变化趋势。本试验采样次数设置为100次,从图3-A可以看出,在采样刚刚开始时,建模变量随着采样次数的增加而快速减少,最后随着采样次数的增加,变量减少的幅度趋于平缓,这个过程便是CARS算法筛选波长变量数由粗选到精选的一个过程;图3-B 中表示的是采样次数与RMSECV之间的关系,随着采样次数的增加,RMSECV值表现出先减小后上升的趋势,当采样次数在37时,RMSECV 的值最小为0.087 8;图3-C 中,每条线表示每个变量在不同采样次数时的回归系数值变化趋势,图中的星垂线表明均方根误差最小的位置。

图3 CARS 运算提取变量原理
Fig.3 Principle of variable extraction by CARS operation
2.6 模型的确定与验证
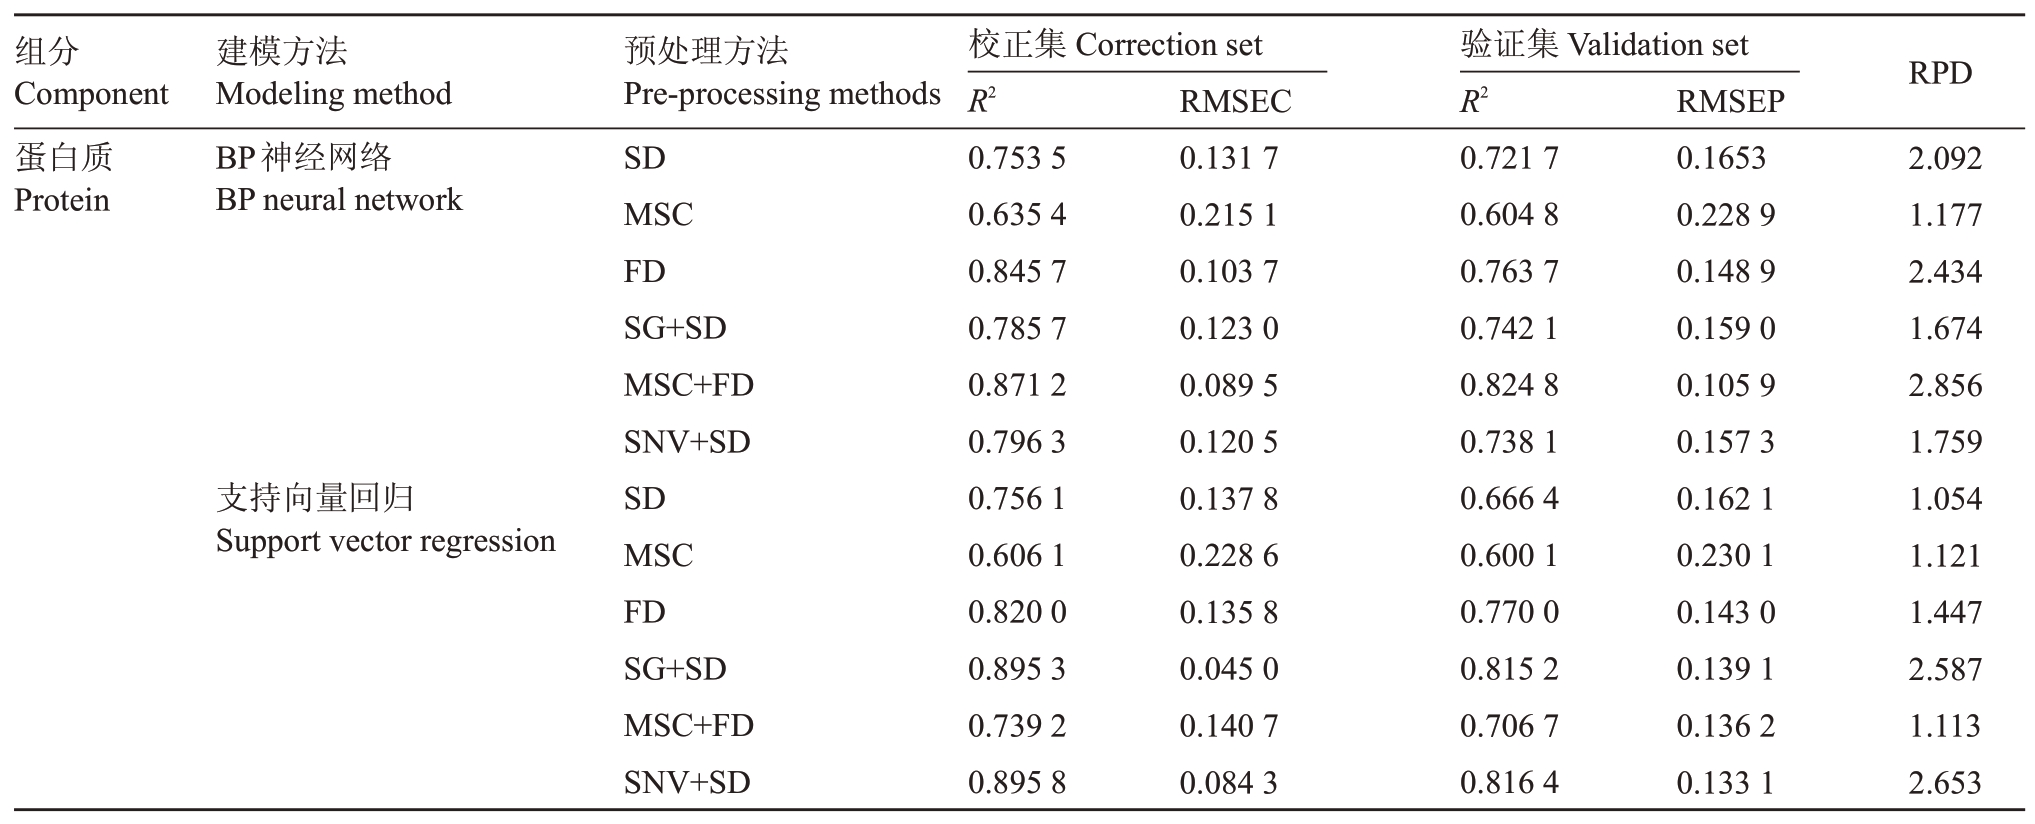
2.6.1 模型的确定 SVR 和BP 神经网络是常用的建模方法。表4 是分别采用SVR 和BP 神经网络所建的检测模型性能比较。从表4 可看出用BP 神经网络法与MSC+FD 组合预处理方法所建出来的模型验证集的决定系数R2为0.825,预测均方根误差RMSEP 为0.105 9,残留预测偏差RPD 为2.856,一般认为RPD≥2 时模型的效果较好[39]。而采用SVR法与SNV+SD、SG+SD的组合预处理方法所建出来的模型虽然有着较高的校正集决定系数,但验证集决定系数较低以及均方根误差差异较大,存在过拟合现象,且残留预测偏差RPD 小于BP 神经网络的RPD值。综上所述,选用MSC+FD+BP神经网络相结合的方法建模,可以达到理想的建模效果[40]。图4为核桃仁蛋白质含量近红外预测模型图,图中横坐标表示核桃仁可溶性蛋白质含量的实测值,纵坐标表示核桃仁可溶性蛋白质含量的预测值,可以发现实测值与预测值之间的相关性显著,其决定系数R2达0.870 8,表明所建模型较稳定。
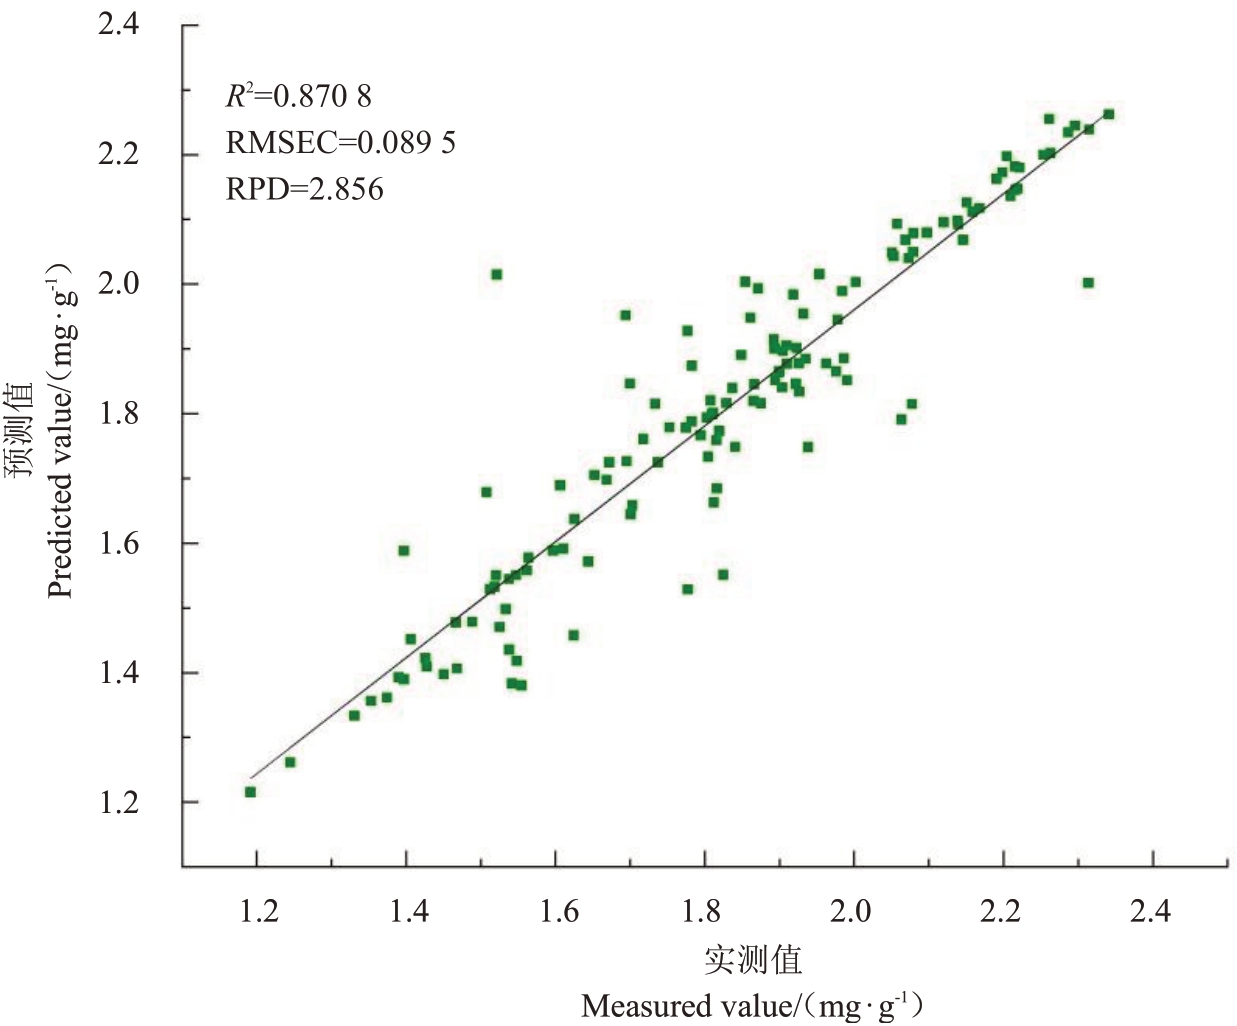
图4 核桃仁定量模型实测值与预测值相关性
Fig.4 Correlation between measured and predicted values of walnut kernel quantitative model
表4 2 种方法所建蛋白质检测模型性能
Table 4 Performance of the protein detection models built by the 2 methods
?
2.6.2 模型的验证 从表5中可以看出,42个验证集样品的实测值和预测值的误差均在0.3%范围以内,可见采用BP神经网络对核桃仁可溶性蛋白质含量的预测值较为准确,模型稳定。由图5可知,验证集的决定系数R2为0.824 8,RMSEP为0.105 9,RPD为2.233,说明可以准确地预测核桃仁样品的蛋白质含量。
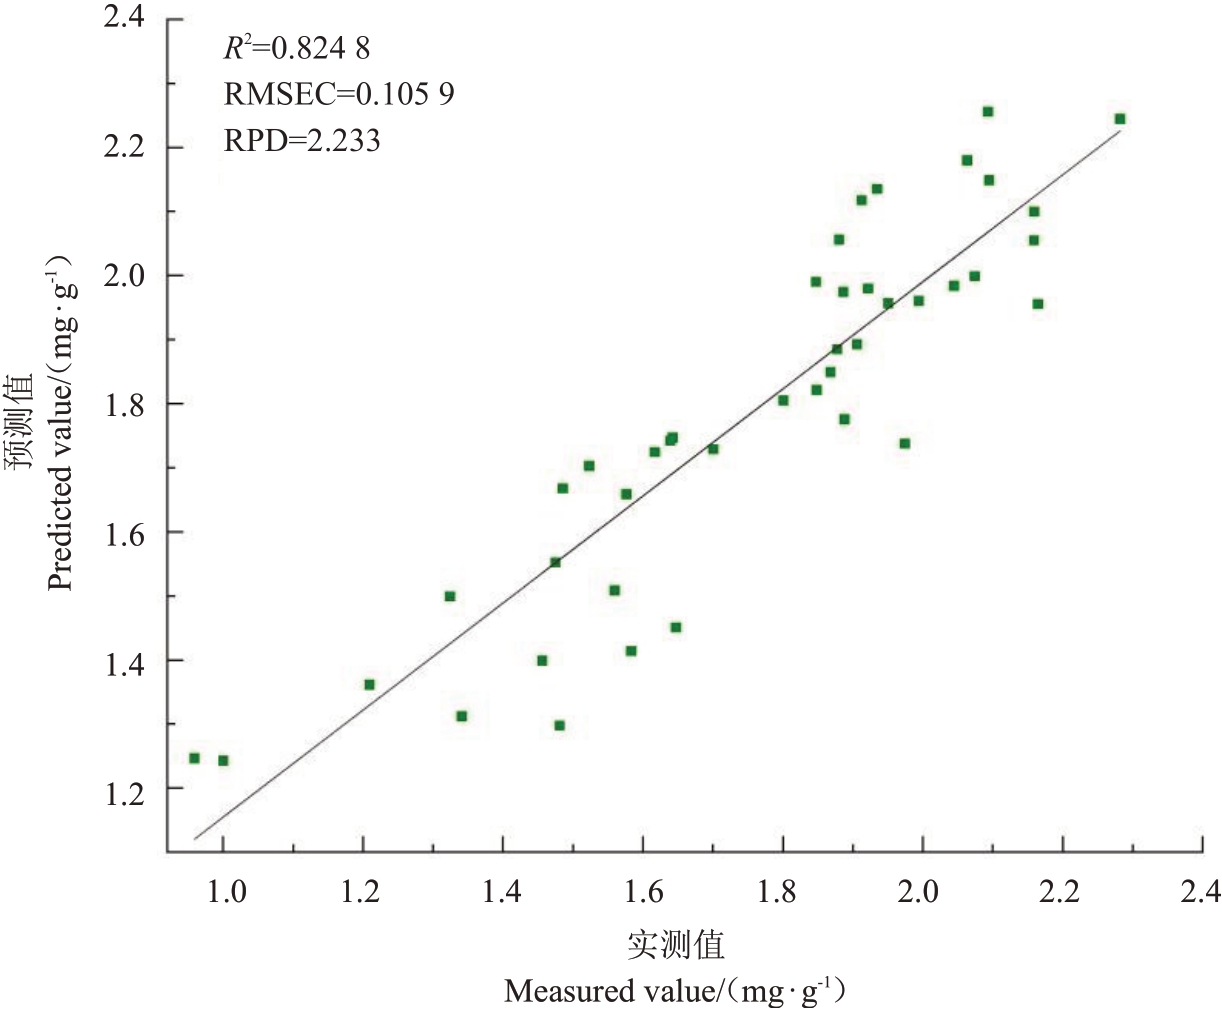
图5 验证集实测值与预测值的相关性
Fig.5 Correlation between the measured and predicted values in the validation set
表5 验证集样品可溶性蛋白质含量的实测值和预测值
Table 5 Measured and predicted values of soluble protein content of the validation set samples

?
3 讨 论
寻求一种快速、准确地检测果品品质的方法对目前的产业发展起着至关重要的作用,近红外光谱技术在水果品种鉴别、加工分级、长势监测和品质评判方面已被广泛应用[41-43]。刘洁等[44]对带壳板栗和栗仁的研究得出,带壳板栗光谱模型对含水率的预测精度低于栗仁光谱模型。后续笔者将进一步探索带壳与整仁核桃光谱的区别。由原始光谱图可以看出,在5311~5485 cm-1、6020~6283 cm-1、7590~7864 cm-1波段范围有着明显的吸收峰。异常样本的出现,会使得预测模型性能降低,在罗林等[45]研究证明,剔除奇异样本可有效提高预测模型的预测相关系数,并且降低预测均方根误差,故剔除异常样本是必要的[46-48]。本研究中,使用马氏距离法在180个样本中剔除了5个奇异值。陈斌等[49]采用PCA结合马氏距离法剔除异常样本,在75个样品中剔除了7个样本。与其结果相比,说明此次试验数据的准确率较高,利于模型的建立。
在光谱扫描过程中,样品的状态、重复次数、光的散射及仪器响应等因素的干扰会导致核桃仁光谱基线漂移和产生噪声信息[50]。为了有效减少上述因素的影响,提高光谱的信噪比[51],建立更可靠的模型,应对采集后的光谱信息进行光谱预处理[52]。通过比较不同光谱预处理效果后,最终选出最佳的预处理是MSC+FD 组合方式,这与黄璐等[53]的结果一致,所建立的预测模型最为理想。在本试验中,样本的近红外光谱数据点有1557 个,而样本数则只有174 个,在建模过程中共线性较严重。加上近红外光谱的冗余信息较多,将会导致建模效果不理想。因此,需对样本进行特征波长的提取。笔者在本研究中运用CARS 法来提取特征波长,与蛋白质含量相关的N-H 泛音范围在5 754.5~7 864.0 cm-1之间。马文强等[54]通过近红外光谱技术针对不同物理状态下的核桃仁进行蛋白质含量的测定,运用间隔偏最小二乘法(IPLS)筛选出1056~1081 nm和1503~1528 nm的波段与本试验结果不一样。原因可能是所使用光谱仪器型号、运用筛选波段的算法以及光谱扫描范围不同。此外还比较了BP 神经网络和SVR 算法预测模型的性能,结果显示,BP 神经网络比SVR 具有更好的预测性能和更强的鲁棒性。通过比较发现,BP 神经网络预测模型的决定系数比SVR的决定系数大,校正均方根误差(RMSEC)和预测均方根误差(RMSEP)比SVR 小,RPD 值比SVR大,很明显BP神经网络具有更强的预测能力。可能是因为BP 神经网络处理非线性关系的能力和广泛的适应能力比SVR强。
4 结 论
笔者在本研究中对采集后的光谱信息进行不同的预处理和特征波段筛选后,采用BP 神经网络与SVR 算法建立核桃仁可溶性蛋白质含量的预测模型。结果表明,BP神经网络算法在特征波段的核桃仁可溶性蛋白质含量预测建模中,模型质量优于SVR算法。因此,MSC+FD+CARS+BP神经网络建模方式更适用于核桃仁可溶性蛋白质含量的预测。
[1] 焦俊,圣阳,王标,马卿效,李春,蒋玲.光谱技术在核桃检测领域的研究进展[J]. 激光与光电子学进展,2021,58(22):44-54.JIAO Jun,SHENG Yang,WANG Biao,MA Qingxiao,LI Chun,JIANG Ling. Research progress on spectroscopy in walnut detection[J]. Laser & Optoelectronics Progress,2021,58(22):44-54.
[2] XIAO C W,WOOD C,HUANG W X,L'ABBÉ M R,GILANI G S,COOKE G M,CURRAN I. Tissue-specific regulation of acetyl-CoA carboxylase gene expression by dietary soya protein isolate in rats[J].British Journal of Nutrition,2006,95(6):1048-1054.
[3] AOKI H,KIMURA K,IGARASHI K,TAKENAKA A.Soy protein suppresses gene expression of acetyl-CoA carboxylase alpha from promoter PI in rat liver[J].Bioscience,Biotechnology,and Biochemistry,2006,70(4):843-849.
[4] 李敏,刘媛,孙翠,孟亚楠,杨克强,侯立群,王钧毅.核桃营养价值研究进展[J].中国粮油学报,2009,24(6):166-170.LI Min,LIU Yuan,SUN Cui,MENG Yanan,YANG Keqiang,HOU Liqun,WANG Junyi. Research advance about nutrients and medicinal value of walnut[J]. Journal of the Chinese Cereals and Oils Association,2009,24(6):166-170.
[5] 殷坤,刘金明,张东杰,张爱武.基于近红外光谱的大米蛋白质含量快速检测[J].食品与机械,2021,37(5):82-88.YIN Kun,LIU Jinming,ZHANG Dongjie,ZHANG Aiwu. Rapid detection of protein contentin rice based on near infrared spectroscopy[J].Food&Machinery,2021,37(5):82-88.
[6] 李赞,高红秀,金萍,石瑛.基于近红外光谱技术马铃薯蛋白质含量定标模型的构建[J].中国马铃薯,2021,35(6):507-513.LI Zan,GAO Hongxiu,JIN Ping,SHI Ying. Establishment of potato protein content calibration model based on near infrared spectroscopy[J].Chinese Potato Journal,2021,35(6):507-513.
[7] 陈勇,吴彩娥,熊智新.基于衰减消去蜻蜓算法的小麦粉蛋白质近红外特征波长优选[J].食品科学,2022,43(14):219-225.CHEN Yong,WU Caie,XIONG Zhixin. Selection of near infrared wavelengths using attenuation elimination-binary dragonfly algorithm for wheat flour protein content prediction[J]. Food Science,2022,43(14):219-225.
[8] 路绪强,袁明,何楠,赵胜杰,朱红菊,刘文革.利用色差仪快速检测西瓜番茄红素含量[J].中国瓜菜,2021,34(4):41-45.LU Xuqiang,YUAN Ming,HE Nan,ZHAO Shengjie,ZHU Hongju,LIU Wenge. Rapid determination of watermelon lycopene content by using chromatic meter[J]. China Cucurbits and Vegetables,2021,34(4):41-45.
[9] 孙雷.利用近红外光谱法检测酸奶中蛋白质和脂肪含量[D].长春:吉林大学,2008.SUN Lei. Using near-infrared spectroscopy to detect the content of protein and fat in yoghourt[D]. Changchun:Jilin University,2008.
[10] 马雪亭,罗华平,高峰,王长旭.近红外光谱技术在苹果检测方面的研究与应用[J]. 食品安全质量检测学报,2022,13(13):4219-4227.MA Xueting,LUO Huaping,GAO Feng,WANG Changxu. Research and application of near-infrared spectroscopy in apple detection[J].Journal of Food Safety&Quality,2022,13(13):4219-4227.
[11] RAHMAN A,WANG S,YAN J S,XU H R. Intact Macadamia nut quality assessment using near-infrared spectroscopy and multivariate analysis[J].Journal of Food Composition and Analysis,2021,102:104033.
[12] 黄志伟,郭拓,黄文静,李冰,徐浩然,叶楚璇,严诗楷,肖雪,罗国安.近红外光谱技术在名贵中药材质量评价中的研究进展[J].中草药,2022,53(20):6328-6336.HUANG Zhiwei,GUO Tuo,HUANG Wenjing,LI Bing,XU Haoran,YE Chuxuan,YAN Shikai,XIAO Xue,LUO Guoan.Research progress of near-infrared spectroscopy in quality evaluation of valuable Chinese medicinal materials[J]. Chinese Traditional and Herbal Drugs,2022,53(20):6328-6336.
[13] 胡静,黄金发,刘小丹,毕洁,王加华,肖安红,舒在习,戴煌.基于近红外光谱技术的猕猴桃品质检测研究进展[J].食品研究与开发,2022,43(2):196-201.HU Jing,HUANG Jinfa,LIU Xiaodan,BI Jie,WANG Jiahua,XIAO Anhong,SHU Zaixi,DAI Huang.Progress in research into kiwifruit quality assessment based on near-infrared spectroscopy[J]. Food Research and Development,2022,43(2):196-201.
[14] 王建伟,陶飞.近红外光谱技术在农产品检测中的应用研究进展[J].安徽农学通报,2021,27(17):155-158.WANG Jianwei,TAO Fei.Application research progress of near infrared spectroscopy technology in agricultural products detection[J].Anhui Agricultural Science Bulletin,2021,27(17):155-158.
[15] 王纯阳,马玉涵,刘斌美,郭盼盼,黄青.近红外透反射光谱测定单粒稻种的蛋白质含量[J]. 核农学报,2019,33(10):2003-2012.WANG Chunyang,MA Yuhan,LIU Binmei,GUO Panpan,HUANG Qing.Determination of protein content in single rice kernels and grains by near-infrared transflectance spectroscopy[J].Journal of Nuclear Agricultural Sciences,2019,33(10):2003-2012.
[16] 王丽萍,陈文杰,赵兴忠,张新.基于近红外漫反射光谱法的大豆粗蛋白和粗脂肪含量的快速检测[J]. 大豆科学,2019,38(2):280-285.WANG Liping,CHEN Wenjie,ZHAO Xingzhong,ZHANG Xin. Rapid determination of crude protein and crude oil content of soybean based on near infrared diffuse reflectance spectroscopy[J].Soybean Science,2019,38(2):280-285.
[17] 鞠皓,姜洪喆,周宏平.油料作物与产品品质近红外光谱及高光谱成像检测研究进展[J].中国粮油学报,2022,37(9):303-310.JU Hao,JIANG Hongzhe,ZHOU Hongping. Research progress of near infrared spectroscopy and hyperspectral imaging in determination on quality of oilseed and its products[J]. Journal of the Chinese Cereals and Oils Association,2022,37(9):303-310.
[18] YANG Y,TONG H B,YANG L C,WU M J. Application of near-infrared spectroscopy and chemometrics for the rapid quality assessment of Sargassum fusiforme[J]. Postharvest Biology and Technology,2021,173:111431.
[19] 张鹏,李江阔,孟宪军,张平,冯晓元,王宝刚.涩柿可溶性单宁的可见/近红外漫反射光谱无损检测研究[J].光谱学与光谱分析,2011,31(4):951-954.ZHANG Peng,LI Jiangkuo,MENG Xianjun,ZHANG Ping,FENG Xiaoyuan,WANG Baogang. Research on nondestructive measurement of soluble tannin content of astringent persimmon using visible and near infrared diffuse reflection spectroscopy[J].Spectroscopy and Spectral Analysis,2011,31(4):951-954.
[20] 李勇,魏益民,王锋. 影响近红外光谱分析结果准确性的因素[J].核农学报,2005,19(3):236-240.LI Yong,WEI Yimin,WANG Feng.Affecting factors on the accuracy of near-infrared spectroscopy analysis[J]. Journal of Nuclear Agricultural Sciences,2005,19(3):236-240.
[21] 李合生.植物生理生化实验原理和技术[M].北京:高等教育出版社,2000.LI Hesheng. Principles and techniques of plant physiological biochemical experiment[M]. Beijing:Higher Education Press,2000.
[22] 王姣姣,刘浩,任贵兴.豌豆品质性状近红外模型建立及区域差异分析[J].植物遗传资源学报,2014,15(4):779-787.WANG Jiaojiao,LIU Hao,REN Guixing. Using Fourier transform near-infrared spectroscopy for the evaluation and regional analysis of pea (Pisum sativum L.)[J]. Journal of Plant Genetic Resources,2014,15(4):779-787.
[23] 黄星奕,钱媚,徐富斌.基于机器视觉和近红外光谱技术的杏干品质无损检测[J].农业工程学报,2012,28(7):260-265.HUANG Xingyi,QIAN Mei,XU Fubin. Nondestructive detection of dried apricots quality based on machine vision and nearinfrared diffuse reflectance spectroscopy technology[J].Transactions of the Chinese Society of Agricultural Engineering,2012,28(7):260-265.
[24] 王勇生,李洁,王博,张宇婷,耿俊林.基于近红外光谱技术评估高粱中粗蛋白质、水分含量的研究[J].动物营养学报,2020,32(3):1353-1361.WANG Yongsheng,LI Jie,WANG Bo,ZHANG Yuting,GENG Junlin. Research on evaluation of crude protein and moisture contents in Sorghum grain based on near-infrared spectroscopy technique[J]. Chinese Journal of Animal Nutrition,2020,32(3):1353-1361.
[25] PENG Y M,JIANG H,WANG X Y. Prediction of crude protein in ramie by near-infrared spectroscopy (NIR)[J]. Agricultural Science&Technology,2016,17(11):2657-2660.
[26] YANG L M,SUN Q. Comparison of chemometric approaches for near- infrared spectroscopic data[J]. Analytical Methods,2016,8(8):1914-1923.
[27] 王世芳,韩平,崔广禄,王冬,刘珊珊,赵跃.SPXY 算法的西瓜可溶性固形物近红外光谱检测[J].光谱学与光谱分析,2019,39(3):738-742.WANG Shifang,HAN Ping,CUI Guanglu,WANG Dong,LIU Shanshan,ZHAO Yue. The NIR detection research of soluble solid content in watermelon based on SPXY algorithm[J]. Spectroscopy and Spectral Analysis,2019,39(3):738-742.
[28] GALVÃO R K H,ARAUJO M C U,JOSÉ G E,PONTES M J C,SILVA E C,SALDANHA T C B. A method for calibration and validation subset partitioning[J]. Talanta,2005,67(4):736-740.
[29] TAN C,LI M L,QIN X. Random subspace regression ensemble for near-infrared spectroscopic calibration of tobacco samples[J].Analytical Sciences,2008,24(5):647-653.
[30] 展晓日,朱向荣,史新元,张卓勇,乔延江.SPXY 样本划分法及蒙特卡罗交叉验证结合近红外光谱用于橘叶中橙皮苷的含量测定[J].光谱学与光谱分析,2009,29(4):964-968.ZHAN Xiaori,ZHU Xiangrong,SHI Xinyuan,ZHANG Zhuoyong,QIAO Yanjiang. Determination of hesperidin in tangerine leaf by near-infrared spectroscopy with SPXY algorithm for sample subset partitioning and Monte Carlo cross validation[J].Spectroscopy and Spectral Analysis,2009,29(4):964-968.
[31] PENG Y F,LUO H P,LUO X N,ZHAN Y.SPXY sample classification method and successive projections algorithm combined with near-infrared spectroscopy for the determination of total sugar content of southern Xinjiang jujube[J]. Advanced Materials Research,2014,1030/1031/1032:352-356.
[32] 冯艳春,张琪,胡昌勤.药品近红外光谱通用性定量模型评价参数的选择[J].光谱学与光谱分析,2016,36(8):2447-2454.FENG Yanchun,ZHANG Qi,HU Changqin. Study on the selection of parameters for evaluating drug NIR universal quantitative models[J].Spectroscopy and Spectral Analysis,2016,36(8):2447-2454.
[33] 何鸿举,王玉玲,陈岩,欧行奇,张正茂,刘玉秀,乔红,李新华.近红外光谱技术在小麦粉品质检测方面的应用研究进展[J].食品工业科技,2020,41(7):345-352.HE Hongju,WANG Yuling,CHEN Yan,OU Xingqi,ZHANG Zhengmao,LIU Yuxiu,QIAO Hong,LI Xinhua. Advances on near-infrared spectroscopy for quality detection of wheat flour[J].Science and Technology of Food Industry,2020,41(7):345-352.
[34] YUN Y H,LI H D,DENG B C,CAO D S.An overview of variable selection methods in multivariate analysis of near-infrared spectra[J]. TrAC Trends in Analytical Chemistry,2019,113:102-115.
[35] CHEN H,LIN Z,TAN C. Fast quantitative detection of sesame oil adulteration by near-infrared spectroscopy and chemometric models[J].Vibrational Spectroscopy,2018,99:178-183.
[36] HUAN K W,CHEN X A,SONG X Y,DONG W.Variable selection in near-infrared spectra:Application to quantitative non-destructive determination of protein content in wheat[J]. Infrared Physics&Technology,2021,119:103937.
[37] LI M,HAN D H,LIU W.Non-destructive measurement of soluble solids content of three melon cultivars using portable visible/near infrared spectroscopy[J]. Biosystems Engineering,2019,188:31-39.
[38] 许锋,付丹丹,王巧华,肖壮,王彬.基于MCCV-CARS-RF 建立红提糖度和酸度的可见-近红外光谱无损检测方法[J].食品科学,2018,39(8):149-154.XU Feng,FU Dandan,WANG Qiaohua,XIAO Zhuang,WANG Bin. Nondestructive detection of sugar content and acidity in red globe table grapes using visible near infrared spectroscopy based on monte-carlo cross validation-competitive adaptive reweighted sampling-random forest (MCCV-CARS-RF)[J]. Food Science,2018,39(8):149-154.
[39] 王铭海.猕猴桃、桃和梨品质特性的近红外光谱无损检测模型优化研究[D].杨凌:西北农林科技大学,2013.WANG Minghai. Study of optimal model for nondestructive detection of kiwifruit,peach and pear quality characteristic by NIR spectroscopy[D]. Yangling:Northwest A & F University,2013.
[40] HARUNA S A,LI H H,WEI W Y,GENG W H,YAO-SAY SOLOMON ADADE S,ZAREEF M,IVANE N M A,CHEN Q S. Intelligent evaluation of free amino acid and crude protein content in raw peanut seed kernels using NIR spectroscopy paired with multivariable calibration[J]. Analytical Methods,2022,14(31):2989-2999.
[41] 李路,黄汉英,赵思明,胡月来,杨素仙.大米蛋白质、脂肪、总糖、水分近红外检测模型研究[J].中国粮油学报,2017,32(7):121-126.LI Lu,HUANG Hanying,ZHAO Siming,HU Yuelai,YANG Suxian. NIR spectra detection model of protein,fat,total sugar and moisture in rice[J]. Journal of the Chinese Cereals and Oils Association,2017,32(7):121-126.
[42] 何勇,郑启帅,张初,岑海燕.基于中红外光谱和化学计量学算法鉴别核桃产地及品种[J]. 光谱学与光谱分析,2019,39(9):2812-2817.HE Yong,ZHENG Qishuai,ZHANG Chu,CEN Haiyan. Identification of walnut origins and varieties with mid-infrared spectroscopy analysis technique[J]. Spectroscopy and Spectral Analysis,2019,39(9):2812-2817.
[43] 汪庆平,黎其万,董宝生,束继红.近红外光谱法快速测定山核桃品质性状的研究[J].西南农业学报,2009,22(3):873-875.WANG Qingping,LI Qiwan,DONG Baosheng,SHU Jihong.Study on the prediction of oils of Carya cathayensis Sargent using near infrared reflectance spectroscopy[J]. Southwest China Journal of Agricultural Sciences,2009,22(3):873-875.
[44] 刘洁,李小昱,李培武,王为,周炜,张军.基于近红外光谱的板栗水分检测方法[J].农业工程学报,2010,26(2):338-341.LIU Jie,LI Xiaoyu,LI Peiwu,WANG Wei,ZHOU Wei,ZHANG Jun. Determination of moisture in chestnuts using near infrared spectroscopy[J]. Transactions of the Chinese Society of Agricultural Engineering,2010,26(2):338-341.
[45] 罗林,庹先国,张贵宇,翟双,朱雪梅,高婧,罗琪.基于异常样品剔除的酒醅近红外定量分析模型的精度提升[J].食品安全质量检测学报,2022,13(9):3017-3025.LUO Lin,TUO Xianguo,ZHANG Guiyu,ZHAI Shuang,ZHU Xuemei,GAO Jing,LUO Qi.Accuracy improvement of near infrared quantitative analysis model for fermented grains based on abnormal sample removal[J].Journal of Food Safety&Quality,2022,13(9):3017-3025.
[46] 郑峰,王睿,宦克为,刘丽莹,石晓光.粳米近红外光谱模型中基于拉依达准则的异常值剔除方法[C]//韶关:第十七届全国分子光谱学学术会议论文集,2012:135-136.ZHENG Feng,WANG Rui,HUAN Kewei,LIU Liying,SHI Xiaoguang.Eliminating abnormal values inkeng-rice NIRS model based on pauta criterion[C]. Shaoguan:Proceedings of the 17th National Conference on Molecular Spectroscopy,2012:135-136.
[47] SHAO X G,BIAN X H,LIU J J,ZHANG M,CAI W S. Multivariate calibration methods in near infrared spectroscopic analysis[J].Analytical Methods,2010,2(11):1662-1666.
[48] WESLEY I J,BARNES R J,MCGILL A E J. Measurement of adulteration of olive oils by near-infrared spectroscopy[J]. Journal of the American Oil Chemists’Society,1995,72(3):289-292.
[49] 陈斌,邹贤勇,朱文静.PCA 结合马氏距离法剔除近红外异常样品[J].江苏大学学报(自然科学版),2008,29(4):277-279.CHEN Bin,ZOU Xianyong,ZHU Wenjing. Eliminating outlier samples in near-infrared model by method of PCA-mahalanobis distance[J]. Journal of Jiangsu University (Natural Science Edition),2008,29(4):277-279.
[50] RINNAN Å,VAN DEN BERG F,ENGELSEN S B. Review of the most common pre-processing techniques for near-infrared spectra[J]. TrAC Trends in Analytical Chemistry,2009,28(10):1201-1222.
[51] PMISHRA P,RUTLEDGE D N,ROGER J M,WALI K,AHMAD KHAN H.Chemometric pre-processing can negatively affect the performance of near-infrared spectroscopy models for fruit quality prediction[J].Talanta,2021,229:122303.
[52] ÇATALTAŞ Ö,TUTUNCU K. A review of data analysis techniques used in near-infrared spectroscopy[J]. European Journal of Science and Technology,2021,25:475-484.
[53] 黄璐,王富豪,郭鲁平,张晓燕,袁星星,薛晨晨,陈新.基于近红外光谱法的绿豆淀粉和蛋白质无损快速检测[J].江苏农业科学,2022,50(19):187-191.HUANG Lu,WANG Fuhao,GUO Luping,ZHANG Xiaoyan,YUAN Xingxing,XUE Chenchen,CHEN Xin. Nondestructive and rapid detection of mung bean starch and protein based on near infrared spectroscopy[J]. Jiangsu Agricultural Sciences,2022,50(19):187-191.
[54] 马文强,张漫,李忠新,杨莉玲.基于近红外光谱的核桃仁蛋白质含量检测分析[J].农业机械学报,2017,48(S1):407-411.MA Wenqiang,ZHANG Man,LI Zhongxin,YANG Liling. Detection and analysis of walnut protein content based on near infrared spectroscopy[J]. Transactions of the Chinese Society for Agricultural Machinery,2017,48(S1):407-411.