中国是桃的原产国,桃树是中国最古老的栽培果树之一,几千年以来,桃一直是中华民族向往美好生活的象征,有着悠久的栽培历史和广泛的地域分布,素有“桃李满天下”之谓[1]。改革开放以来,我国桃产业得到快速发展,自1993 年我国桃生产面积和总产量全面超越意大利与美国,成为世界第一产桃大国。2021 年我国桃产业总产值近千亿元,生产、流通和零售从业人员过千万,是助推乡村产业兴旺、农民生活富裕的主要经济支柱[2-3]。不仅如此,桃还具有独特的景观价值和文化内涵,是建设美丽乡村、推进产业融合、弘扬农耕文化的重要产业支撑。
我国桃产业在经历了快速发展后也逐渐进入瓶颈期。国际市场,随着我国“人口红利”优势的逐步消失,劳动力成本上升,资源约束增强[4-6];国内市场,当前桃产品同质化严重,优质、高端桃供给不足和低质、普通桃产能过剩的结构性矛盾突出,桃阶段性供过于求和供给不足并存的压力突出[1]。国内桃销售市场是“大市场,小业户”的格局,以家庭为单位的分散经营模式,使得市场竞价力量集中于批发商[1],桃农在“价格天花板”和“成本地板”的双重挤压下增收困难[7];不仅如此,分散的经营模式还对提高桃产业生产管理技术水平具有抑制作用[8]。同时,也应注意到电子商务对改变生产经营方式、促进流通与贸易、提高农户收入等方面产生的积极作用[9]。
因此,基于经济高质量发展和乡村振兴战略背景,为推进桃产业供给侧结构性改革,提高桃产业生产管理技术水平,构建有效的市场衔接机制,并为桃产业技术研发攻关提供产业经济方面的参考指标。笔者收集联合国商品贸易数据库(UN Comtrade)中桃生产贸易数据、国家桃产业技术体系的部分调研数据和产业数据、国家桃产业技术体系部分报告材料,用定量与定性相结合的方法,从国际、国内2 个视角,桃产业贸易、生产和消费3 个方面,对中国桃产业经济展开分析,并基于产业经济发展现状和发展规律,从要素环境、品种与布局、品牌与标准化、产销体系、技术研发与推广等方面预测桃产业的发展趋势。
1 桃国际生产与贸易变化趋势
1.1 桃国际生产变化趋势
截止到2020 年,全球共有80 余个国家和地区种植桃,总栽培面积达到150 万hm2,年产量超过2450 万t。2000—2015 年,全球桃栽培面积逐年上升,2015 年达到最高值163 万hm2,之后逐年下降并基本稳定在150 万hm2。中国是世界上最大的桃生产国,其栽培面积占全球栽培面积比重由2000 年的37%增加至2020 年的52%(图1)。

图1 2000—2020 年全球桃生产面积变化情况(UN Comtrade)
Fig.1 Change of global peach production area from 2000 to 2020(UN Comtrade)
2000—2020 年,全球桃产量呈现持续上升趋势,总产量由2000 年的1328 万t 增长至2020 年的2457 万t,增长了85%。全球桃总产量持续增加的原因在于中国桃总产量的持续增加。2000—2020年,中国桃总产量从383 万t 增加至1500 万t,增加了近3 倍。而其他国家桃总产量基本保持稳定(图2)。中国桃产量的迅速增加一方面是总面积的增加,另一方面源于生产技术推动了生产率的提高。2000 年中国桃生产率为8230 kg·hm-2,远低于全球平均水平10 422 kg·hm-2;到2020 年中国桃生产率提高到19 283 kg·hm-2,远超全球平均水平。

图2 2000—2020 年全球桃总产量变化情况(UN Comtrade)
Fig.2 Change of global peach total output from 2000 to 2020(UN Comtrade)
1.2 桃国际贸易变化趋势
2000—2020 年,全球桃贸易量大致可以分为2个阶段,2000—2017 年贸易量基本呈现持续上升态势,2017 年达到最高值后开始下降,而2020 年全球桃贸易量降至2012 年水平(180 万t 左右),主要是因为COVID-19 新冠疫情阻碍了国际贸易。而全球桃贸易额变化大致可以分为3 个阶段,第1 阶段(2000—2008 年)为持续上升,随着贸易量的增加贸易额稳步上升;第2 阶段(2008—2013 年)为波动上升,随着贸易量增加呈现隔年上升态势;第3 阶段(2014—2020 年)为相对稳定,桃贸易额基本稳定在22 亿元左右。2014—2019 年,桃贸易量均超过190万t,最高达236 万t,而贸易额维持22 亿元左右,表明了桃国际市场达到了相对饱和状态,贸易量的增加对贸易额提升的作用不显著(图3)。

图3 2000—2020 年鲜食桃全球贸易量与贸易额(UN Comtrade)
Fig.3 Global trade quantity and value of fresh peach from 2000 to 2020(UN Comtrade)
根据UN Comtrade 数据,对近10 年(2011—2020 年)的主要国家和地区鲜食桃进出口情况进行具体分析。在出口国家和地区方面,欧盟、土耳其、智利、美国和中国的出口总量占世界总出口量80%以上,但比重呈现逐年下降趋势。中国生产了全球50%以上的桃,但出口量仅占全球贸易量的3%左右,基本在国内销售(表1)。主要原因在于,中国国内市场消费量庞大,并且桃易腐性强,国际间长距离运输的交易成本高。
表1 主要国家和地区鲜食桃出口量
Table 1 Export quantity of fresh peach of main countries and regions ×104t
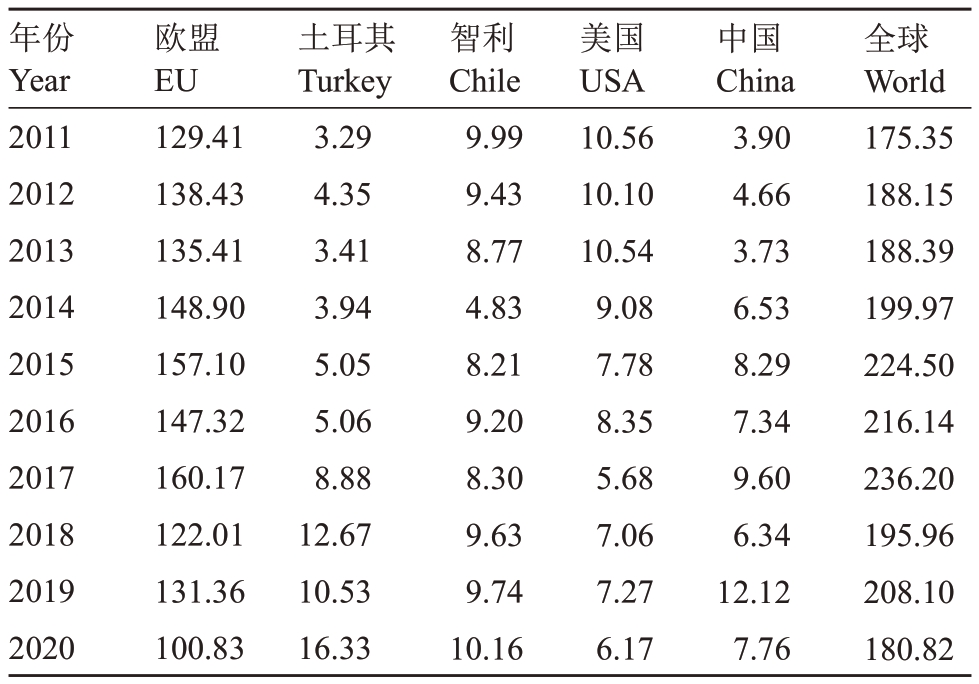
年份Year 2011 2012 2013 2014 2015 2016 2017 2018 2019 2020欧盟EU 129.41 138.43 135.41 148.90 157.10 147.32 160.17 122.01 131.36 100.83土耳其Turkey 3.29 4.35 3.41 3.94 5.05 5.06 8.88 12.67 10.53 16.33智利Chile 9.99 9.43 8.77 4.83 8.21 9.20 8.30 9.63 9.74 10.16美国USA 10.56 10.10 10.54 9.08 7.78 8.35 5.68 7.06 7.27 6.17中国China 3.90 4.66 3.73 6.53 8.29 7.34 9.60 6.34 12.12 7.76全球World 175.35 188.15 188.39 199.97 224.50 216.14 236.20 195.96 208.10 180.82
在进口国家和地区方面,约有150 个国家和地区进口了桃。其中,欧盟、俄罗斯、白俄罗斯、哈萨克斯坦、加拿大、美国等国家和地区进口量占全球桃进口量的75%以上;进口额占全球桃进口额的70%以上。中国在2011—2016 年间基本未进口鲜食桃,但从2017 年起中国鲜食桃进口量逐年增加,从2017 年的0.04 万t 增长至2020 年的3.7 万t,增长超过9 倍(表2)。
表2 主要国家和地区鲜食桃进口量
Table 2 Import quantity of fresh peach in main countries and regions ×104t
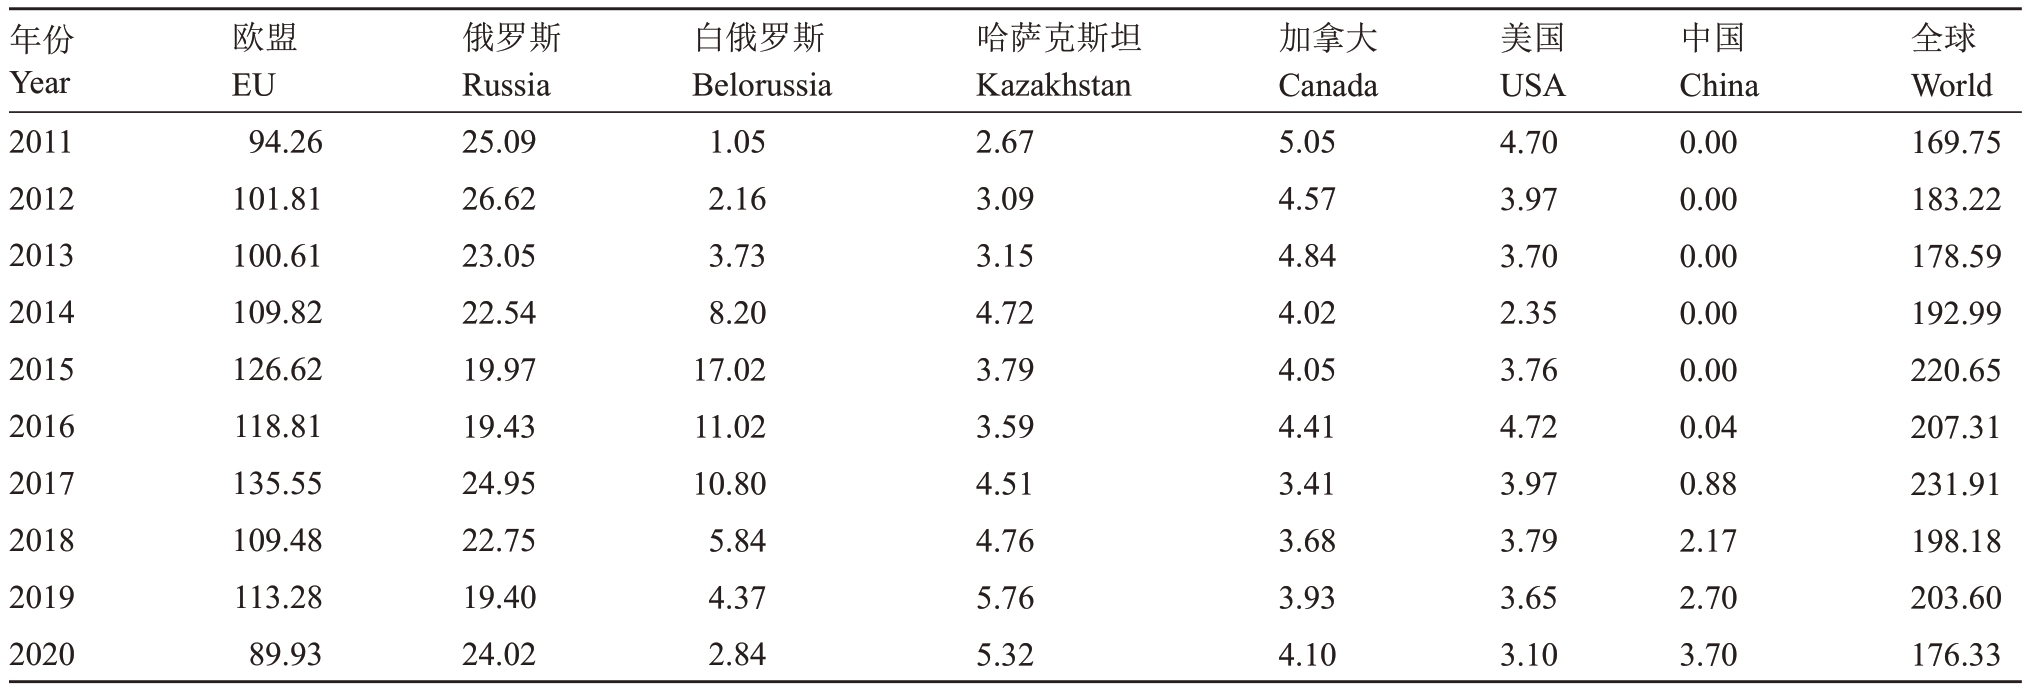
年份Year 2011 2012 2013 2014 2015 2016 2017 2018 2019 2020欧盟EU 94.26 101.81 100.61 109.82 126.62 118.81 135.55 109.48 113.28 89.93俄罗斯Russia 25.09 26.62 23.05 22.54 19.97 19.43 24.95 22.75 19.40 24.02白俄罗斯Belorussia 1.05 2.16 3.73 8.20 17.02 11.02 10.80 5.84 4.37 2.84哈萨克斯坦Kazakhstan 2.67 3.09 3.15 4.72 3.79 3.59 4.51 4.76 5.76 5.32加拿大Canada 5.05 4.57 4.84 4.02 4.05 4.41 3.41 3.68 3.93 4.10美国USA 4.70 3.97 3.70 2.35 3.76 4.72 3.97 3.79 3.65 3.10中国China 0.00 0.00 0.00 0.00 0.00 0.04 0.88 2.17 2.70 3.70全球World 169.75 183.22 178.59 192.99 220.65 207.31 231.91 198.18 203.60 176.33
综上来看,全球每年产出的鲜食桃中,约有10%的鲜食桃进入国际市场。而中国生产出世界50%的桃,但出口量却只有3%左右。作为桃生产大国的中国,在国际市场上还有较大空间可以拓展,但同时也需要注意国际消费市场容量问题。
1.3 中国桃贸易趋势
1.3.1 中国鲜食桃进出口格局 根据UN Comtrade 数据,对近10 年(2011—2020 年)中国的鲜食桃进出口情况进行具体分析。进口方面,2016 年之前,我国基本未进口鲜食桃。2016 年以后开始从澳大利亚、西班牙进口鲜食桃。智利油桃自2016 年11 月起获准进入中国市场后,成为中国最大的鲜食桃进口国,2020 年进口量达到2.98 万t。智利、澳大利亚与中国在鲜食桃贸易上具有季节互补性,未来的进口增长潜力较大。出口方面,中国鲜食桃的出口国家和地区不到20 个,中国的鲜食桃主要出口到越南、俄罗斯、哈萨克斯坦,2011—2020 年,每年出口到3 个国家的桃占中国总出口量的85%。
1.3.2 中国桃加工品进出口格局 2011—2020 年,中国平均每年从10 余个国家和地区进口桃加工品,并向80 余个国家出口桃加工品。具体来看(图4),2011—2015 年中国桃加工品进口额持续上升,之后持续下降;平均每年进口额占全球总贸易额比重为1.8%。并且,中国主要从南非进口,进口额占总进口额超过90%。2014 年之前,中国桃加工品出口额呈持续上升趋势,2014 年后逐步下降。相比于出口鲜食桃,中国出口的桃加工品占全球桃加工品贸易总额比重在20%左右,是世界主要的桃加工品出口国。但主要出口日本和美国2 个国家,出口这2 个国家的比重合计达到60%,抵抗市场风险的能力较低。
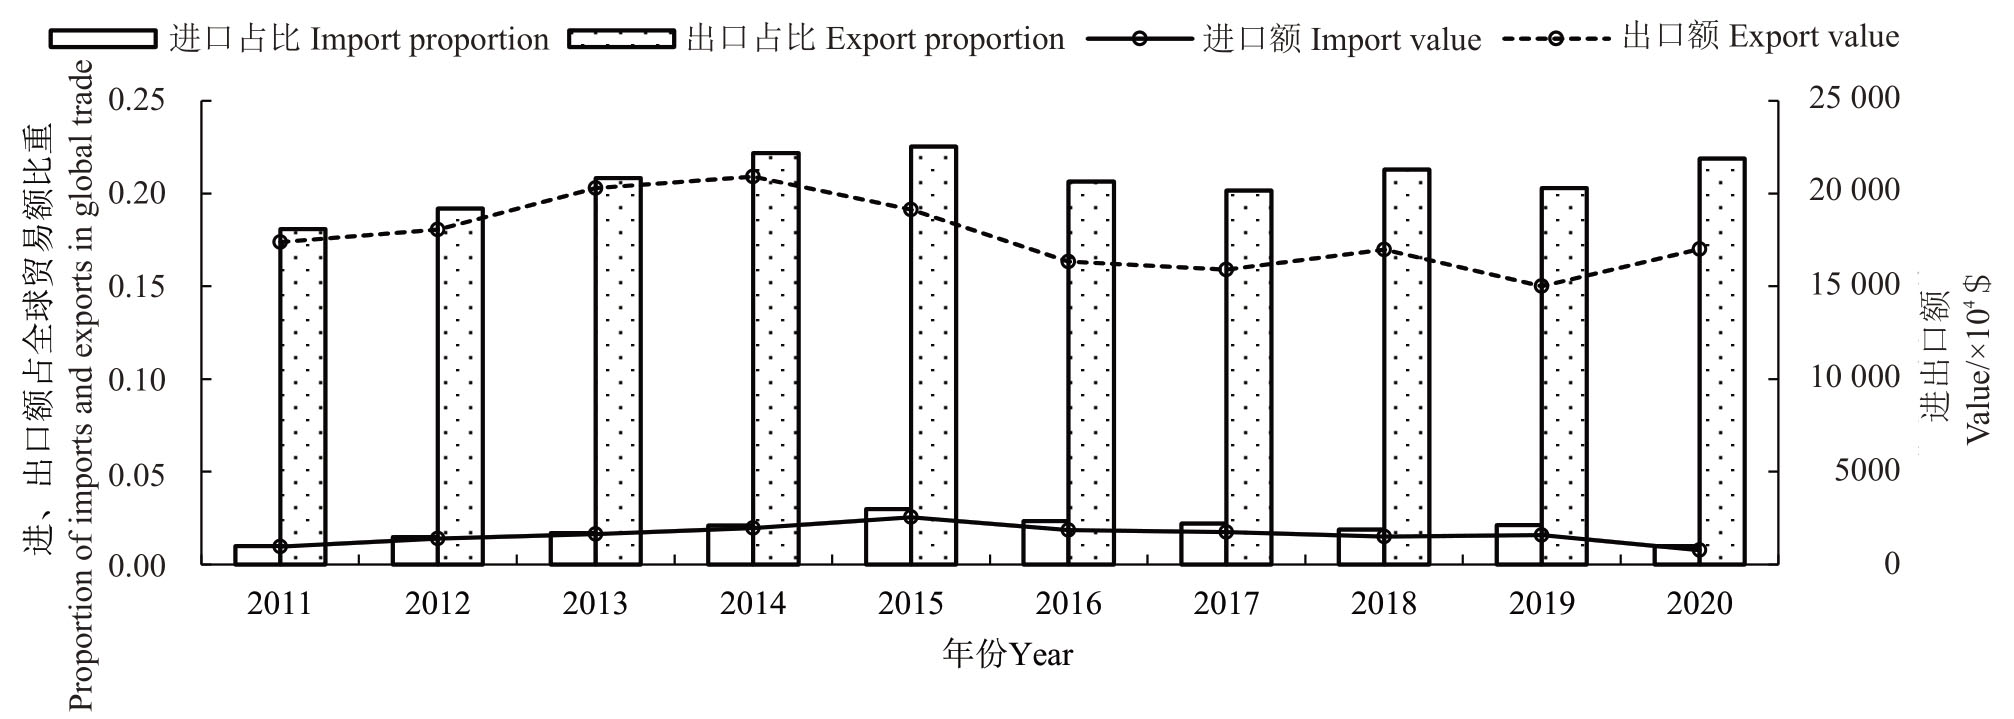
图4 2011—2020 年中国桃加工品进出口额及比重(UN Comtrade)
Fig.4 Import and export value and proportion of Processed peach products in China from 2011 to 2020(UN Comtrade)
2 中国桃生产情况
2.1 中国桃生产总体情况
根据UN Comtrade 数据,2000—2020 年我国桃产量持续增加,由2000 年的383 万t 增长到2020年的1500 万t。而桃栽培面积在2015 年达到顶峰后逐步下降,并稳定在78 万hm2 左右,我国桃产业发展方式逐步从增量转向提质(图5)。

图5 2000—2020 年中国桃栽培面积和产量(UN Comtrade)
Fig.5 Total cultivated area and total output of peach in China from 2000 to 2020(UN Comtrade)
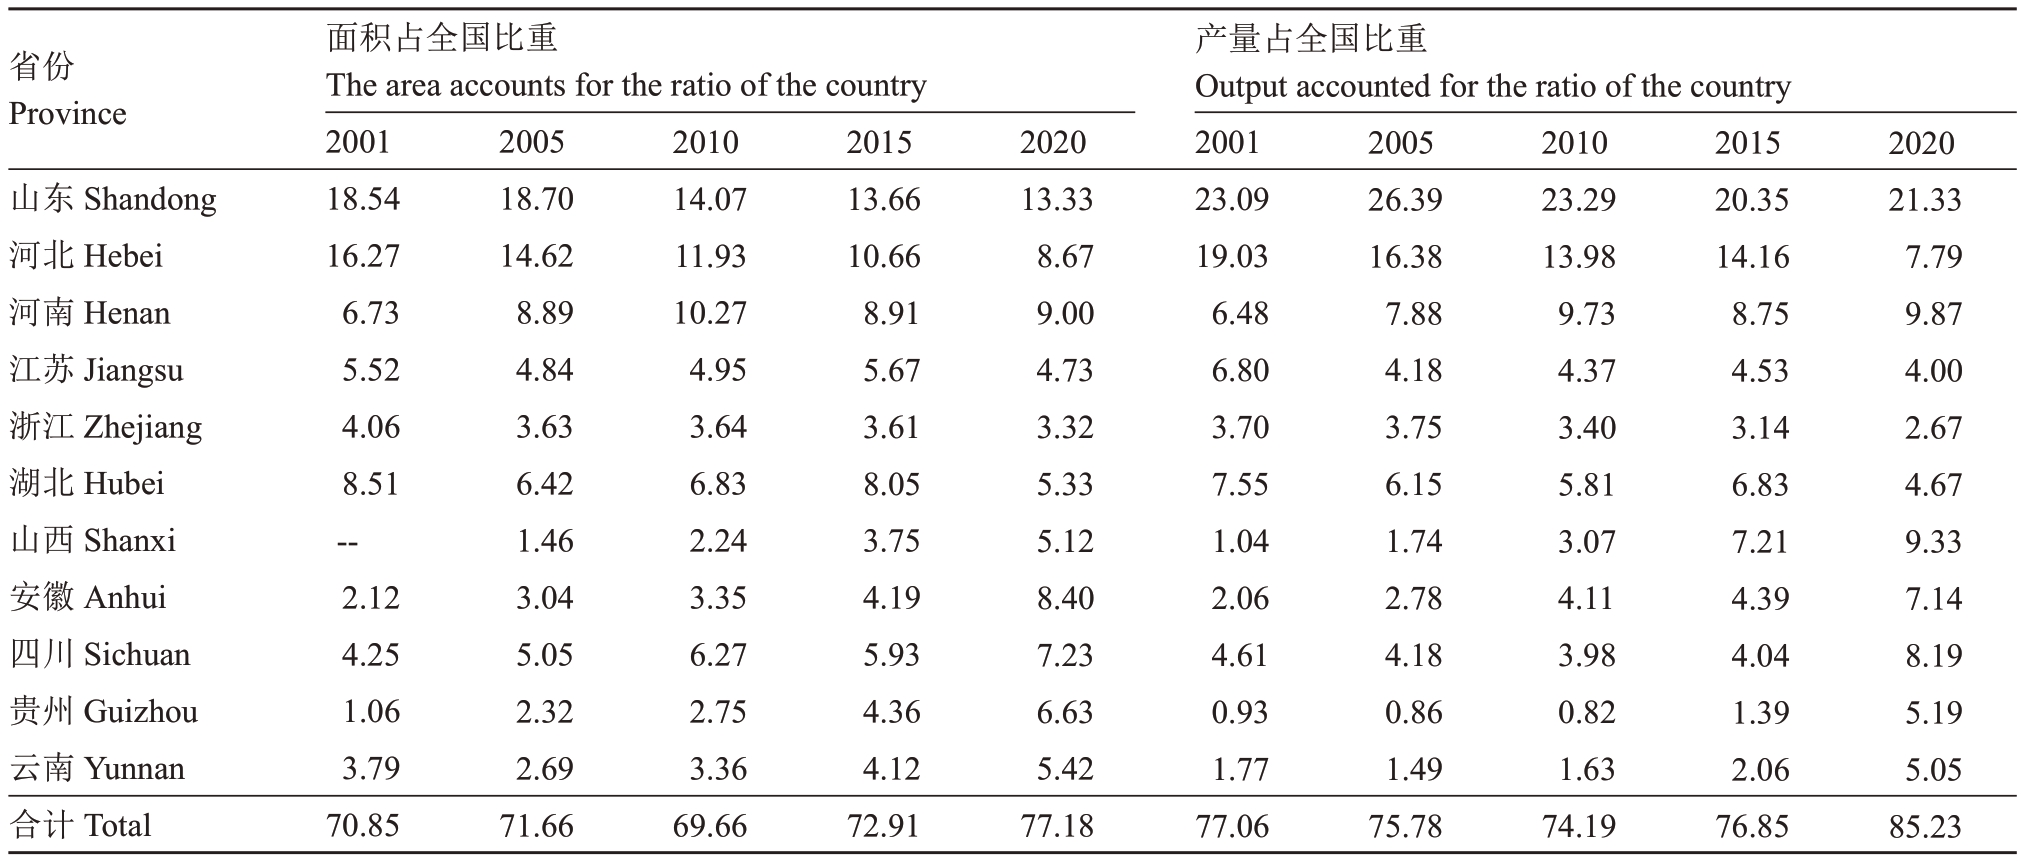
表3 列举了我国主要的生产桃省份的栽培面积与产量情况。山东、河北、江苏和浙江4 省的面积和产量占全国的比重均呈现下降趋势,山西、安徽、四川、贵州和云南5 省的面积和产量占全国的比重均呈现迅速增加趋势。山东始终是我国桃栽培面积最大和产量最高的省份,尽管2001 年以来栽培面积比重呈下降趋势,但产量占据我国桃总产量超过20%。
表3 中国主要桃生产省份栽培面积与产量占比情况
Table 3 Proportion of cultivated area and output in main peach producing provinces in China%
注:数据来源:2016 年之前的数据来自农业农村部种植业司,2020 年数据来自国家桃产业技术体系综合试验站在年度经济会议上的报告。
Note:Data source:The data before 2016 are from the Planting Industry Department of the Ministry of Agriculture and Rural Affairs, and the data in 2020 are from the report of the National Peach Industry Technology System Comprehensive Test Station at the annual economic conference.
2020 21.33 7.79 9.87 4.00 2.67 4.67 9.33 7.14 8.19 5.19 5.05 85.23省份Province山东Shandong河北Hebei河南Henan江苏Jiangsu浙江Zhejiang湖北Hubei山西Shanxi安徽Anhui四川Sichuan贵州Guizhou云南Yunnan合计Total面积占全国比重The area accounts for the ratio of the country 2001 18.54 16.27 6.73 5.52 4.06 8.51--2.12 4.25 1.06 3.79 70.85 2005 18.70 14.62 8.89 4.84 3.63 6.42 1.46 3.04 5.05 2.32 2.69 71.66 2010 14.07 11.93 10.27 4.95 3.64 6.83 2.24 3.35 6.27 2.75 3.36 69.66 2015 13.66 10.66 8.91 5.67 3.61 8.05 3.75 4.19 5.93 4.36 4.12 72.91 2020 13.33 8.67 9.00 4.73 3.32 5.33 5.12 8.40 7.23 6.63 5.42 77.18产量占全国比重Output accounted for the ratio of the country 2001 23.09 19.03 6.48 6.80 3.70 7.55 1.04 2.06 4.61 0.93 1.77 77.06 2005 26.39 16.38 7.88 4.18 3.75 6.15 1.74 2.78 4.18 0.86 1.49 75.78 2010 23.29 13.98 9.73 4.37 3.40 5.81 3.07 4.11 3.98 0.82 1.63 74.19 2015 20.35 14.16 8.75 4.53 3.14 6.83 7.21 4.39 4.04 1.39 2.06 76.85
2.2 中国桃生产具体情况
利用桃产业技术体系在2017—2021 年对主产区桃生产经营主体的微观调查数据,对中国桃生产的具体情况进行分析。
从品种数量与结构看,平均每户种植桃品种数量超过7 个,其中普通桃占比超过75%。由于我国近些年将早熟桃作为育种目标之一[10],早熟桃比例持续增加,中熟桃比例逐步下降;同时云贵川、湖北、浙江等省份利用地理优势发展早熟桃,使得早熟桃栽培面积迅速增长。截止到2021 年,主要桃生产省份不同熟期桃的栽培面积早、中、晚熟桃比例为44∶32∶24,早熟桃比重最高、晚熟桃比重最低。河南、湖北和浙江早熟桃比重超过60%,江苏中熟桃比重最高,山东晚熟桃比重最高(表4)。整体看,我国桃产业品种结构相对均衡,但部分产区早熟品种过多,同类型果实同期大量成熟,出现了积压滞销现象。此外,单户桃农种植品种数量过多,资源配置效率偏低;并且,种植品种的杂乱往往使得产业技术难以精准配套,标准化体系建设相对落后,制约桃产业高质量发展。
表4 主要桃生产省份不同熟制桃的栽培面积比例
Table 4 Composition of peach ripening system in major peach producing provinces%
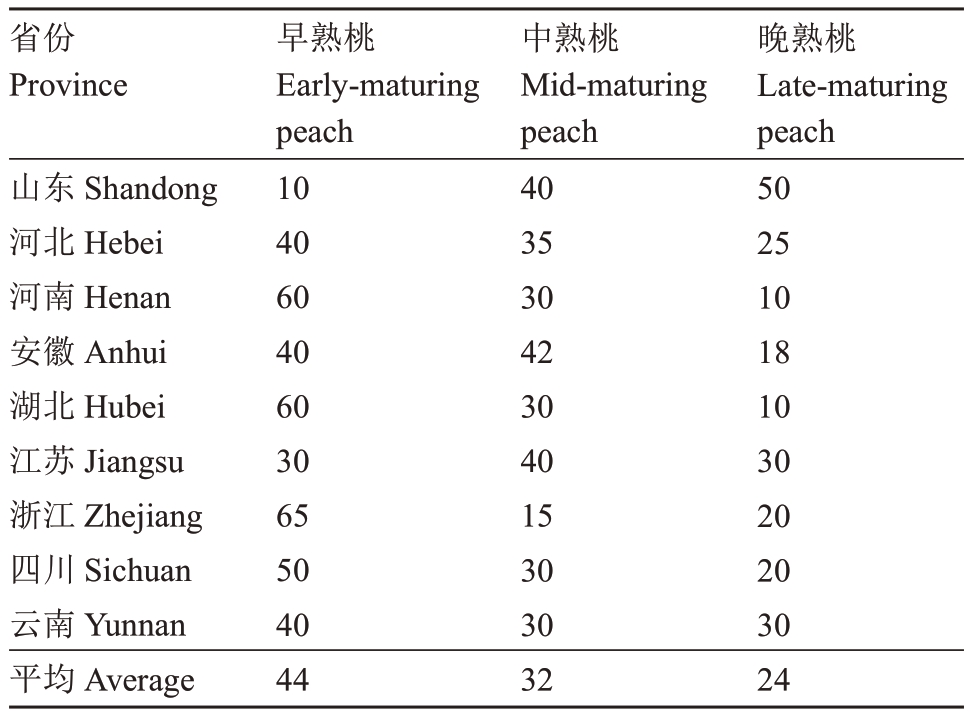
注:数据来源:各省份桃熟制构成来源于国家桃产业技术体系在各省的综合试验站。
Note:Data source: The composition of peach ripening system in each province came from the Comprehensive Test Station of National Peach Industry Technology System in each province.
晚熟桃Late-maturing peach 50 25 10 18 10 30 20 20 30 24省份Province山东Shandong河北Hebei河南Henan安徽Anhui湖北Hubei江苏Jiangsu浙江Zhejiang四川Sichuan云南Yunnan平均Average早熟桃Early-maturing peach 10 40 60 40 60 30 65 50 40 44中熟桃Mid-maturing peach 40 35 30 42 30 40 15 30 30 32
劳动力结构严重约束了桃产业的发展。2018—2021 年,我国桃产业中人工成本占比呈持续上升趋势(表5)。并且,桃产业劳动力年龄偏高的问题突出,桃生产者的平均年龄达到50 岁,平均生产经验超过15 (a年),意味着桃产业劳动力年龄偏高,且有继续增高的趋势。作为劳动密集型农业产业,桃产业的健康持续发展面临着劳动力的巨大约束。相对应的桃产业单位面积均收入成本比(收入/成本)也呈现着波动下降趋势。
表5 2017—2021 年桃产业收入成本比和人工成本占比
Table 5 Revenue cost ratio and labor cost ratio of peach industry from 2017 to 2021

注:数据来源:国家桃产业技术体系产业经济研究室在各年度收集的各主产省份微观桃农数据,并进行整理计算。
Note:Data source: Industrial Economic Research Office of National Peach Industry Technology System collected data of micro peach farmers in major producing provinces in each year,and sorted out and calculated.
年份Year收入成本比Revenue cost ratio人工成本占比Labor cost ratio 1.241.931.721.891.50 0.380.360.380.420.43 20172018201920202021
3 中国桃消费市场特征
我国的桃产业目前形成了从生产、批发到零售/加工的完整产业链,整个供应链以批发市场连接生产与消费[3]。桃市场供应链结构以批发市场为界分为“生产—流通”和“流通—消费”2 个环节[1]。随着农产品电子商务的迅速发展,线上渠道也逐渐成为桃的重要销售渠道之一。
3.1 桃批发市场特征
桃的销售价格具有较强的季节性波动,早熟桃价格最高,波动幅度也最大;中熟桃的价格相对较低,价格也较为稳定。在各年度内,桃价格先快速上升,一般在5 月初达到最高值后开始持续下降;7—8月份桃的价格低并且相对稳定,9 月后桃价格开始缓慢上升,呈现出U 形的变化趋势(图6)。从整体趋势看,桃价格波动在呈现下降趋势,主要在于桃栽培面积的相对稳定。但早熟桃的价格波动程度在2018 年后再次上升,主要在于早熟桃栽培面积和产量的增加,市场竞争激烈程度提高。
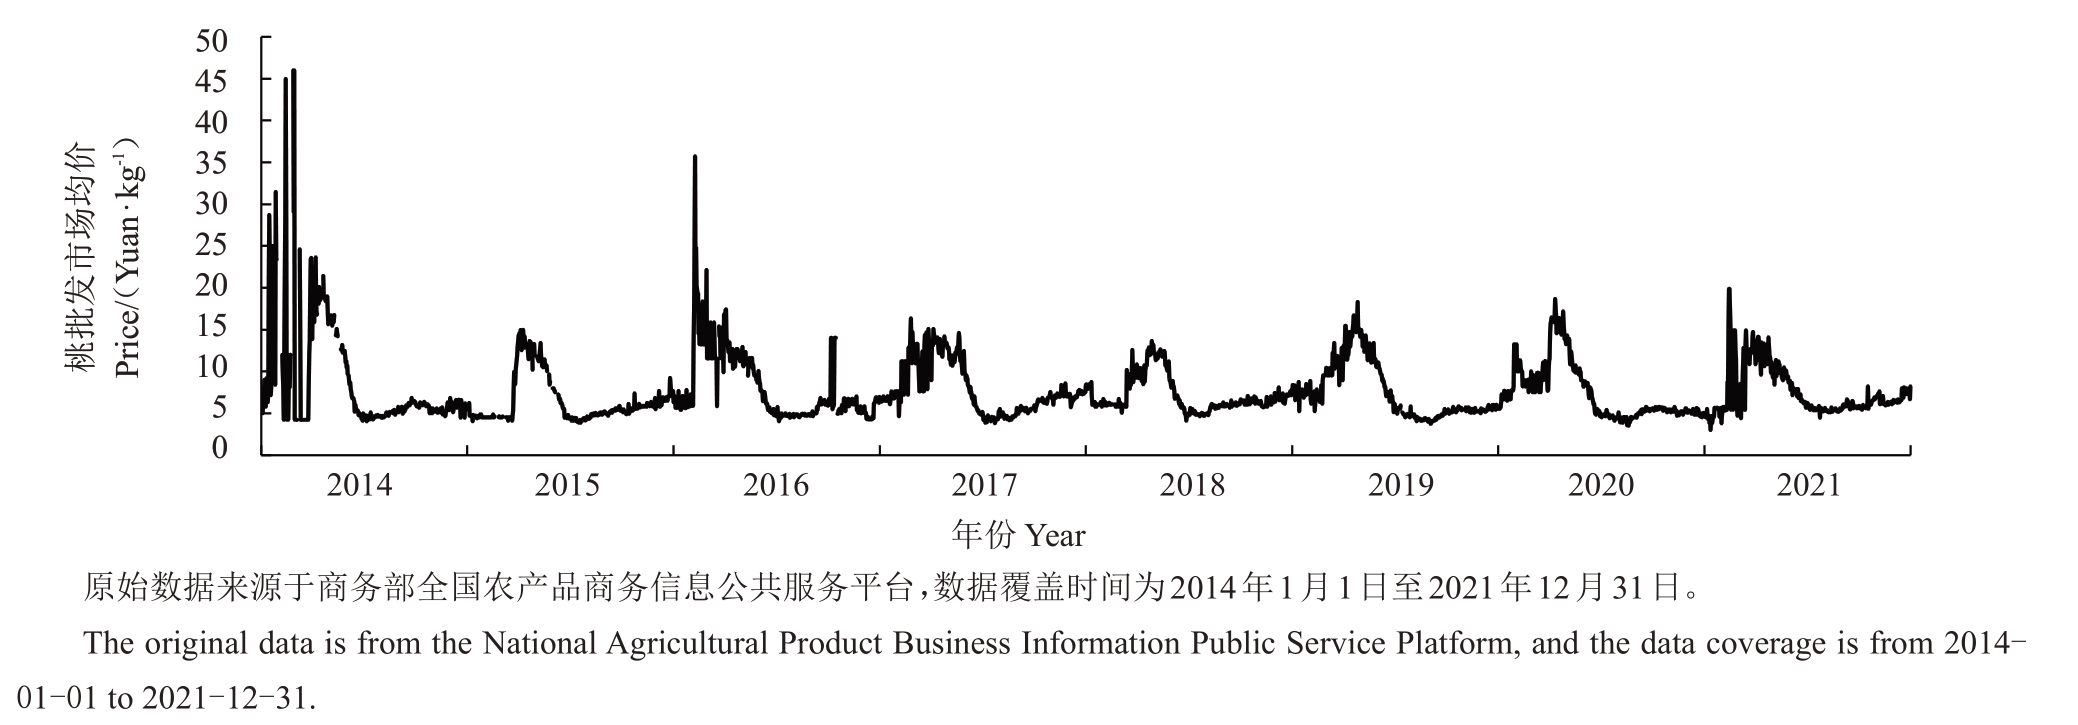
图6 2014—2021 年全国主要农产品批发市场桃日价格趋势
Fig.6 Peach daily price trend in National peach wholesale market from 2014 to 2021
3.2 桃零售市场特征
3.2.1 桃零售市场价格变化情况 为比较零售市场和批发市场的差异,笔者选取桃产品主要消费城市南京市作为调查城市,选择苏果超市(苏果超市所销售桃种类较为齐全、价格适中,是市民主要的桃购买场所之一,具有一定的代表性)为固定抽样点进行调查。总体看,普通桃(水蜜桃)的售卖在时间上分布最广,整个调查期内均有销售。油桃销售期集中在8 月之前,同市场上其他桃相比价格较低。黄桃的销售期也较长,但销售量少于水蜜桃和油桃。蟠桃销量少、销售期短,价格相对较高。4 种类型的桃中,水蜜桃和油桃的价格变动幅度相对较大,黄桃、蟠桃的价格变动幅度相对较小(图7)。

图7 2020 年南京华润苏果超市不同类型桃零售价格
Fig.7 Retail prices of different peach types in Nanjing China resources Suguo supermarket in 2020
3.2.2 消费者桃消费偏好特征 为分析消费者桃消费的偏好特征,课题组通过问卷星对北京、上海、广州、深圳4 个桃主要消费城市的消费者进行问卷调查。共发放问卷1895 份,有效样本量1825 份,有效率达96.3%,其中北京630 份、上海595 份、广州和深圳共600 份。从表6 可以看出,消费者购买桃时最关注的属性依次为:质地、新鲜程度、表面有无缺陷,其次是价格。包装、地理标志和品牌偏好程度则排在最后3 位。由此可以看出,虽然消费市场中的普通桃基本处于饱和状态,但是消费者对绿色优质桃产品具有强烈需求。然而消费者对桃品质没有区分能力,难以对质量进行识别,仅通过外观进行判断。说明了在推动桃产业标准化、品牌化、可追溯的高质量发展过程中任务艰巨。
表6 消费者对桃不同属性的偏好
Table 6 Consumers’preferences for different peach attributes
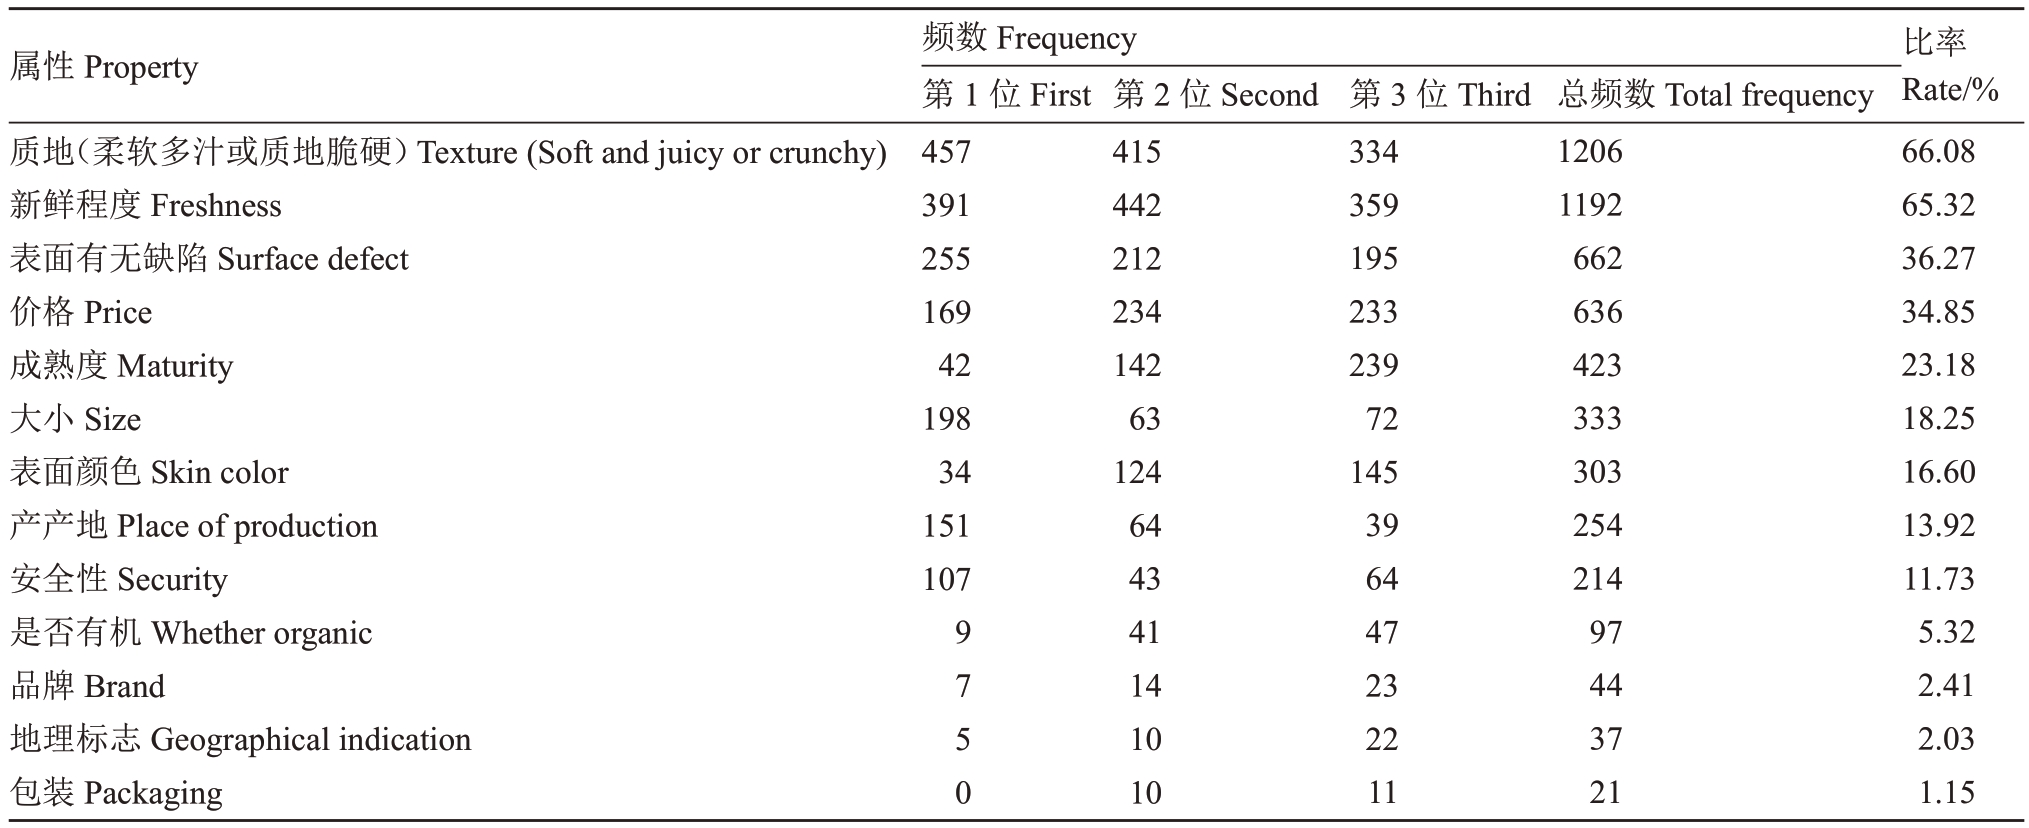
属性Property质地(柔软多汁或质地脆硬)Texture(Soft and juicy or crunchy)新鲜程度Freshness表面有无缺陷Surface defect价格Price成熟度Maturity大小Size表面颜色Skin color产产地Place of production安全性Security是否有机Whether organic品牌Brand地理标志Geographical indication包装Packaging频数Frequency第1 位First 457 391 255 169 42 198 34 151 107 9 7 5 0第2 位Second 415 442 212 234 142 63 124 64 43 41 14 10 10第3 位Third 334 359 195 233 239 72 145 39 64 47 23 22 11总频数Total frequency 1206 1192 662 636 423 333 303 254 214 97 44 37 21比率Rate/%66.08 65.32 36.27 34.85 23.18 18.25 16.60 13.92 11.73 5.32 2.41 2.03 1.15
笔者在本文中根据桃的属性(果皮颜色、果肉颜色、大小、成熟度、质地),对消费购买偏好展开进一步分析。从表7 可以看出,消费者更加偏爱果皮颜色为“以红色(或玫瑰色)为主,底色为黄色(或奶油色)”的桃,占比达到65.7%,对于果皮颜色的偏好在地区间也无显著差异。在果肉颜色上,喜欢白肉桃和黄肉桃的消费者人数较为均衡,有21.26%的消费者表示无所谓,说明果肉颜色对于消费者影响不大。对于桃的大小,偏好“中等桃(1 个150~200 g)”的消费者人数最多,达到67.01%;其次是“大桃(1个250~350 g)”,占比为25.97%。喜欢“七八分熟”的消费者占到了八成以上,但受制于货架期等客观因素,市场中有些桃往往达不到适宜的成熟度,不仅降低了商品率,还无法满足消费者需求。在质地方面,偏好柔软多汁和肉质脆硬的消费者人数分别占总人数的50.96%和37.86%,另有11.18%的消费者表示“无所谓都可以”,总体而言消费者更偏好柔软多汁质地的桃。
表7 消费者对桃不同属性的偏好
Table 7 Consumer preferences for different properties of peaches%
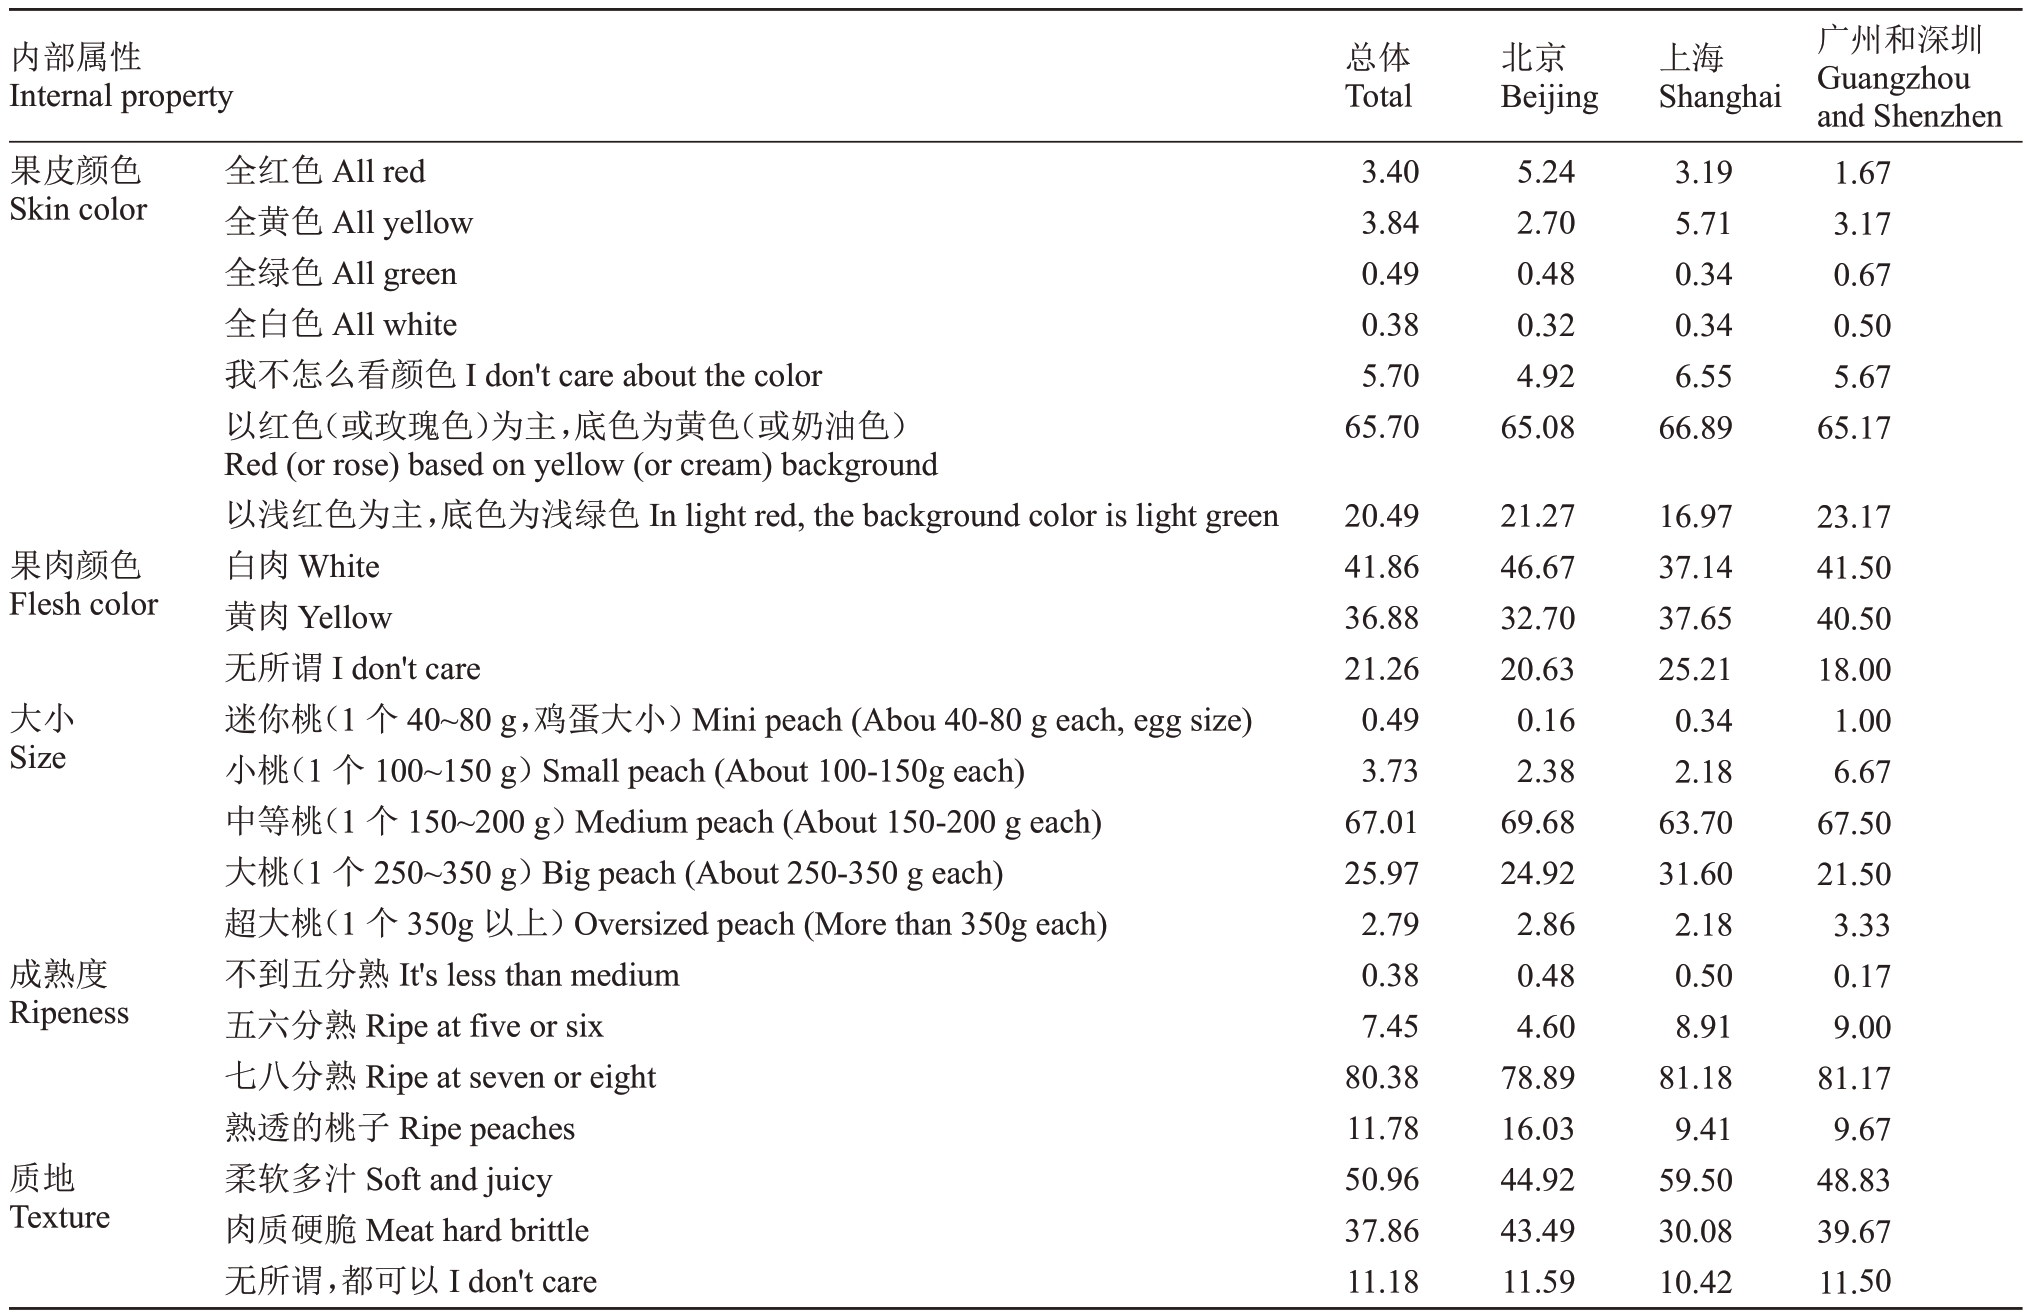
内部属性Internal property果皮颜色Skin color总体Total果肉颜色Flesh color大小Size成熟度Ripeness质地Texture全红色All red全黄色All yellow全绿色All green全白色All white我不怎么看颜色I don′t care about the color以红色(或玫瑰色)为主,底色为黄色(或奶油色)Red(or rose)based on yellow(or cream)background以浅红色为主,底色为浅绿色In light red,the background color is light green白肉White黄肉Yellow无所谓I don′t care迷你桃(1 个40~80 g,鸡蛋大小)Mini peach(Abou 40-80 g each,egg size)小桃(1 个100~150 g)Small peach(About 100-150g each)中等桃(1 个150~200 g)Medium peach(About 150-200 g each)大桃(1 个250~350 g)Big peach(About 250-350 g each)超大桃(1 个350g 以上)Oversized peach(More than 350g each)不到五分熟It′s less than medium五六分熟Ripe at five or six七八分熟Ripe at seven or eight熟透的桃子Ripe peaches柔软多汁Soft and juicy肉质硬脆Meat hard brittle无所谓,都可以I don′t care 3.40 3.84 0.49 0.38 5.70 65.70 20.49 41.86 36.88 21.26 0.49 3.73 67.01 25.97 2.79 0.38 7.45 80.38 11.78 50.96 37.86 11.18北京Beijing 5.24 2.70 0.48 0.32 4.92 65.08 21.27 46.67 32.70 20.63 0.16 2.38 69.68 24.92 2.86 0.48 4.60 78.89 16.03 44.92 43.49 11.59上海Shanghai 3.19 5.71 0.34 0.34 6.55 66.89 16.97 37.14 37.65 25.21 0.34 2.18 63.70 31.60 2.18 0.50 8.91 81.18 9.41 59.50 30.08 10.42广州和深圳Guangzhou and Shenzhen 1.67 3.17 0.67 0.50 5.67 65.17 23.17 41.50 40.50 18.00 1.00 6.67 67.50 21.50 3.33 0.17 9.00 81.17 9.67 48.83 39.67 11.50
3.3 桃电子商务渠道发展特征
电子商务的迅速发展使得桃线上销售成为可能,并逐渐成为桃销售的重要渠道之一。如图8 所示,2019 年8 月至12 月,电子商务平台桃销售量为320.79 万单,销售额达到15 909.19 万元;2020年和2021 年,电子商务平台桃销售量分别为1 074.5 万单和493.43 万单,销售额分别为36 029.65万元和17 868.53 万元,相对于传统渠道占比还较低。2020 年受新冠疫情影响,桃线上渠道销售量迅猛增长。随着疫情防控工作的深入推进以及疫情局势的逐渐稳定,2021 年桃线上销售量有所回落,且较2019 年同期也有所下降。从销售时间段看,主要集中在5—8 月份。6 月份则是销售量最高的月份,7 月份是销售额最多的月份,可能是因为主要品牌水蜜桃在7 月份集中上市进而带动桃价格上涨。
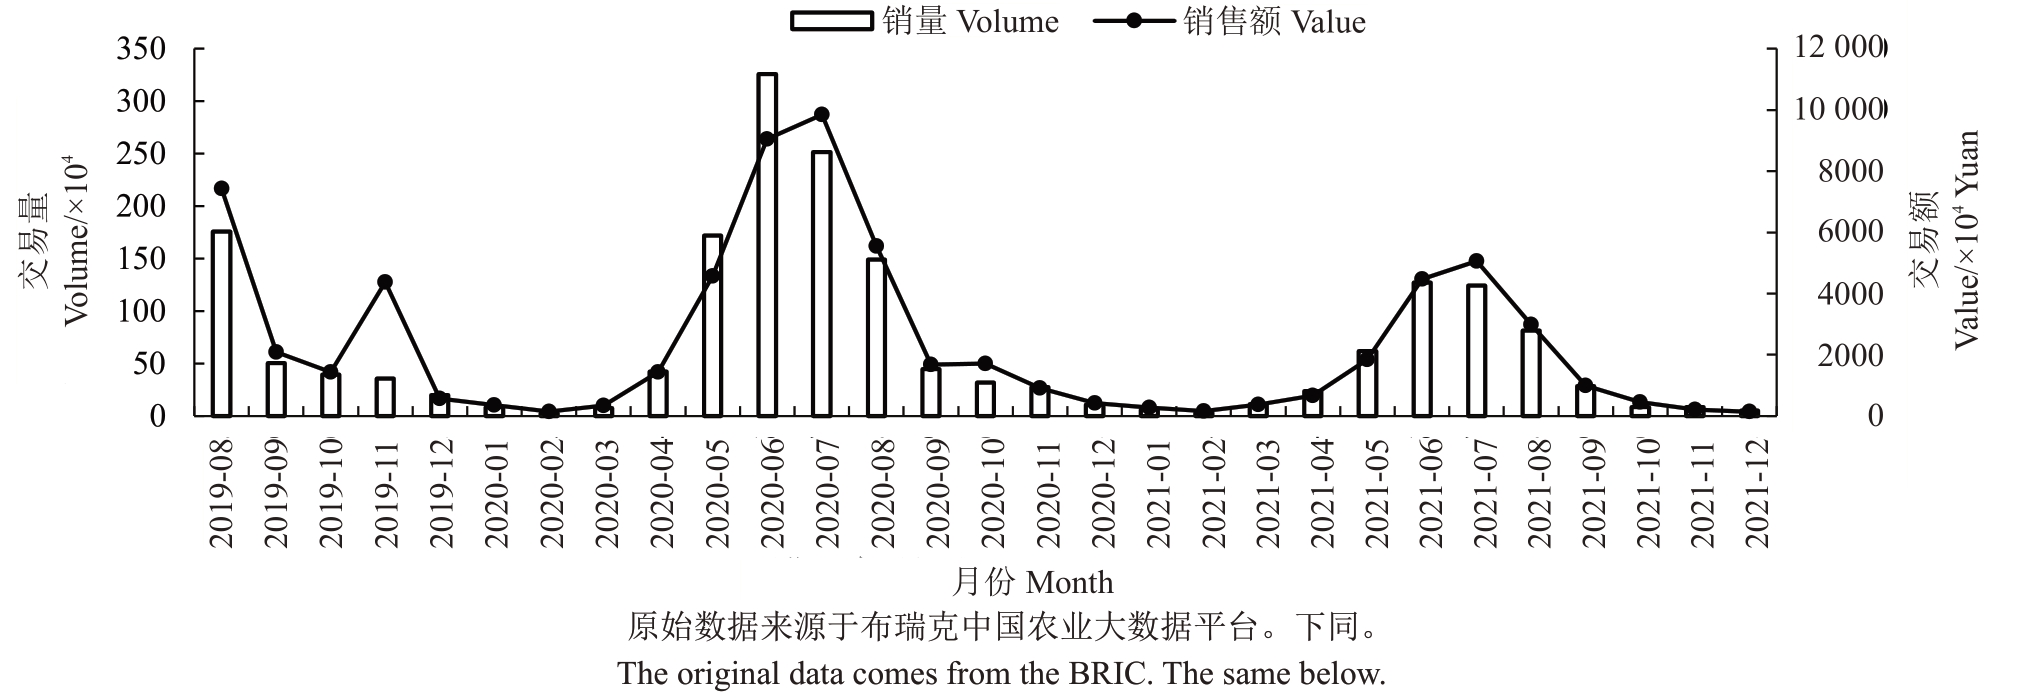
图8 2019—2021 年水蜜桃电子商务销售量与销售额
Fig.8 E-commerce sales volume and sales volume of peach from 2019 to 2021
表8 列出了阳山水蜜桃、蒙阴蜜桃、龙泉驿水蜜桃、奉化水蜜桃、开远蜜桃、镇宁水蜜桃、郑州蜜桃、咸宁蜜桃和凤凰水蜜桃线上销售量之和占所有水蜜桃线上销售量的比重。可以看出,7 月份几类品牌水蜜桃的销售量占比最大,6 月份次之。在一定程度上佐证了7 月份主要名桃销售量的增加带动了桃价格上涨,进而促使7 月销售额增大的解释。
表8 主要水蜜桃品种电子商务平台销售量占电子商务平台总销量比重
Table 8 Main varieties of peach e-commerce platform sales proportion of total e-commerce platform sales%

注:布瑞克中国农业大数据平台对于该数据的收集已停止,表中数据选择月份相对完整的2018年数据进行分析。
Note: BRIC has stopped collecting this data, and the data in the table are for 2018,which is relatively complete.
月份Month比重Ratio 1 月Jan.0.09 2 月Feb.0.01 3 月Mar.0.15 4 月Apr.9.39 5 月May 11.20 6 月Jun.22.78 7 月Jul.41.33 8 月Aug.15.37 9 月Sept.2.75 10 月Oct.0.55
总体来看,桃销售市场是“大市场,小业户”的格局,市场流通无序,产业“两头散,中间乱”问题突出。大多数桃产区过分依赖客商收购,这种当日现货交易机制决定了只能存在单纯的市场关系,市场竞价力量集中于批发商,使得产区价格被收购商控制,消费市场价格被渠道控制[11-12]。桃产业中知名品牌少,制约了桃产业向纵深发展。并且以家庭为单位的分散经营模式,难以形成合力,导致果农的品牌意识差,品质优势无法转化成品牌和价格优势。在需求端,消费者重价格轻品质,农贸市场和超市仍是桃的主要终端渠道,主流消费群体对桃的品质难以识别,存在逆向选择问题,使得消费者对价格更为敏感而非品质。消费以鲜果为主,为保证终端果品的新鲜度与完整度,中间环节损耗严重,尽管消费者愿意为此买单但桃农却未能由此获益,反而还要承担来自下游的价格风险。
4 中国桃产业发展趋势
4.1 劳动力制约程度逐步提高,桃农收入增速逐渐放缓
桃产业生产的人工占比高,劳动力成本的不断攀升使得桃生产成本较高;劳动力年龄增加趋势短期内难以得到缓解。当前外部环境复杂,国内外经济下行压力巨大,农业“两板挤压”、“两灯限行”常态化,加之新投产桃园陆续进入盛果期以及产业技术的逐步提高,我国的桃产量还将继续增加,局部地区的产销矛盾会进一步加深,桃农收入增速逐渐放缓。
4.2 品种结构进一步调整,产区布局进一步优化
早熟桃比重在近几年增加较快,早中熟品种的市场销售压力将会增大。未来,早熟桃市场竞争会更加激烈,早熟品种面积在稳定后将逐步下降,晚熟品种栽培面积会相对提高,中熟品种还将保持相对稳定状态。对于具体种类,黄桃、蟠桃等特色品种越来越受到欢迎和重视,价格相对较高且比较稳定;并且消费者对于白肉和黄肉桃的偏好程度渐趋均衡,黄桃的栽培面积还会进一步增加。受中国桃消费习性的影响,质地柔软多汁、果皮以红色(或玫瑰色)为主且底色为黄色(或奶油色)、中大个的桃依然是消费主流。在品种结构调整的同时,产区还将进一步优化,由于各产区资源禀赋存在差异,各产区需要根据地区比较优势进行选种和布局,这符合产业发展和升级的客观要求。此外,桃不仅是主要的农业产业,还具有独特的景观价值和文化内涵。着力打造成各具特色的生态观光游、农事体验游、节庆文化游、文旅融合的现代桃园,形成特色鲜明、竞争力强的区域优势产业将是桃产业发展的重要方向。
4.3 品牌塑造力度逐步提升,标准化生产渐成趋势
消费市场,普通桃基本处于饱和状态,消费者对于绿色优质桃产品具有强烈需求,推进桃产业由增产向提质转变是趋势所在,桃果实品质会进一步提高。想实现优质优价则需要打造品牌,品牌不仅能够带来溢价增值,还能够培育和稳定消费群体[13-15]。因此,要加强政企合作,增强品牌建设意识,积极推进优质桃及其加工品的品牌注册,建设区域品牌,加强品牌宣传,进而扩大品牌和产区的影响力。研究表明,标准化生产能够增强品牌对收益的促进作用,并通过质量可识别来保障渠道稳定性[16]。因此,从品种选育、生产管理、采后分级、冷链保鲜、贮运到销售,需要形成完整的技术标准化体系。建立区域内生产者之间的联合、联动,推动标准化生产体系的落地,生产绿色、优质桃产品,提高种植效益。同时,建立具有深度追溯能力的质量追溯系统,维护品牌渠道和保障食品安全[17]。
4.4 物流和产销体系逐步完善,电商渠道销售比例持续上升
随着国家对交通等基础设施建设的持续投入,以及采后技术研发力度加大,跨地区物流和销售将会更加普遍,冷链技术应用得到增多,使得果实贮藏运输的损耗率进一步下降。桃种植专业大户、企业等新型经营主体逐渐增多,销售端竞价能力得到提升,销售渠道逐渐趋向多元化。随着“直播带货”“团购拼单”“短视频营销”等新型网络营销方式的异军突起,传统电商平台的逐步优化,桃果实销售时空范围将进一步扩大,电商渠道销售比例将持续上升。
4.5 省工省力技术被广泛采用,生产服务组织逐步发展
省工省力机械、栽培技术的研发与推广是破解劳动力制约产业发展的重要举措。随着信息获取的便利化程度提高,桃农对技术的信息不对称性逐步降低,省力化、机械化、标准化的高效优质栽培模式将被广泛应用。产业规模扩大和升级会引发专业分工,桃产业中的生产性服务组织将会快速发展,有助于提高产业标准化建设和缓解劳动力年龄大的问题。因此,需要进一步提高生产性服务业在桃产业中的比重,大力培育专业化服务队伍和组织。
[1]国家桃产业技术体系.中国现代化农业产业可持续发展战略研究(桃分册)[M].北京:中国农业出版社,2016.China Agriculture Research System(Peach).Study on the sustainable development strategy of China′s modern agricultural industry(Peach volume)[M].Beijing:China Agriculture Press,2016.
[2]邓秀新.关于我国水果产业发展若干问题的思考[J].果树学报,2021,38(1):121-127.DENG Xiuxin.Thoughts on the development of China’s fruit industry[J].Journal of Fruit Science,2021,38(1):121-127.
[3]陈超,徐磊.流通型龙头企业主导下果品产业链的整合与培育:基于桃产业的理论与实践[J].农业经济问题,2020,41(8):77-90.CHEN Chao,XU Lei.The integration and cultivation of the fruit industry chain under the leadership of the leading enterprise of circulation type:Based on the theory and practice of peach industry[J].Issues in Agricultural Economy,2020,41(8):77-90.
[4]耿献辉,卢华,周应恒.劳动力成本上升对我国水果产业的影响:以梨产业为例[J].农林经济管理学报,2014,13(5):461-466.GENG Xianhui,LU Hua,ZHOU Yingheng. Impact of rising labor cost on China’s fruit industry:A case study of pear industry[J]. Journal of Agro-Forestry Economics and Management,2014,13(5):461-466.
[5]颜小挺,祁春节.我国柑橘出口定价实证研究:基于主要出口市场需求的分析[J].价格理论与实践,2016(6):125-128.YAN Xiaoting,QI Chunjie.An empirical study on China′s citrus export pricing:An analysis based on the demand of major export markets[J].Price:Theory&Practice,2016(6):125-128.
[6]周应恒,刘余,张晓恒.基于Rotterdam 模型的中国苹果汁出口波动分析[J].农林经济管理学报,2016,15(2):125-132.ZHOU Yingheng,LIU Yu,ZHANG Xiaoheng. Fluctuation in Chinese apple-juice export volume based on the Rotterdam model[J]. Journal of Agro-Forestry Economics and Management,2016,15(2):125-132.
[7]张红宇.新常态下的农民收入问题[J].农业经济问题,2015,36(5):4-11.ZHANG Hongyu. Farmers′ income under the new normal[J]. Issues in Agricultural Economy,2015,36(5):4-11.
[8]李凡凡,孙洪武.规模经营能否提高鲜食葡萄种植户的生产技术效率:基于江苏省葡萄生产基地344 户农户的调查数据[J].农业技术经济,2021(5):133-143.LI Fanfan,SUN Hongwu.Can large:Scale management increase the production technical efficiency of table grape growers?Based onsurveydataof344farmersfromJiangsugrapeproductionase[J].Journal ofAgrotechnical Economics,2021(5):133-143.
[9]陈卫洪,王莹,王晓伟.电商发展对农产品进出口贸易的影响分析[J].农业技术经济,2020(4):134-142.CHEN Weihong,WANG Ying,WANG Xiaowei.Analysis of the impact of E-commerce development on agricultural products import and export trade[J]. Journal of Agrotechnical Economics,2020(4):134-142.
[10]王力荣. 中国桃品种改良历史回顾与展望[J]. 果树学报,2021,38(12):2178-2195.WANG Lirong. History and prospect of peach breeding in China[J].Journal of Fruit Science,2021,38(12):2178-2195.
[11]卢奇,洪涛,张建设.我国特色农产品现代流通渠道特征及优化[J].中国流通经济,2017,31(9):8-15.LU Qi,HONG Tao,ZHANG Jianshe. Study on the characteristics and optimization of modern circulation channels of agricultural products with local characteristics in China[J]. China Business and Market,2017,31(9):8-15.
[12]黄建华.政府双重干预下基于渠道商价格欺诈的农产品交易演化博弈模型[J].中国管理科学,2016,24(11):66-72.HUANG Jianhua. The evolutionary game model of agri-food transaction in consideration of dealers’price fraud and government′s double intervention[J]. Chinese Journal of Management Science,2016,24(11):66-72.
[13]李丹,周宏,周力.品牌溢价与农产品质量安全:来自江苏水稻种植的例证[J].财经研究,2021,47(2):34-48.LI Dan,ZHOU Hong,ZHOU Li.Brand premium and the quality and safety of agricultural products:Examples from rice planting in Jiangsu Province[J]. Journal of Finance and Economics,2021,47(2):34-48.
[14]姜长云,杜志雄.关于推进农业供给侧结构性改革的思考[J].南京农业大学学报(社会科学版),2017,17(1):1-10.JIANG Changyun,DU Zhixiong.Thoughts on promoting supplyside structural reform of agriculture[J]. Journal of Nanjing Agricultural University(Social Sciences Edition),2017,17(1):1-10.
[15]冷鹏,周楷轩,崔爱华,王鹏,袁升凯,马长生,宋丙国.后疫情时代速冻蔬菜产业发展现状与对策研究[J].中国瓜菜,2021,34(10):125-128.LENG Peng,ZHOU Kaixuan,CUI Aihua,WANG Peng,YUAN Shengkai,MA Changsheng,SONG Bingguo. Development status and countermeasures of quick-frozen vegetable industry in post-epidemic era[J]. China Cucurbits and Vegetables,2021,34(10):125-128.
[16]陈超,孔月,徐磊.区域公共品牌、标准化生产对果农经营收入的影响:基于冀、苏、赣三省771 户果农的实证检验[J].农林经济管理学报,2021,20(5):569-577.CHEN Chao,KONG Yue,XU Lei. Impact of regional public brands and standardized production on operating income of fruit growers:Based on empirical test of 771 fruit farmers in Hebei,Jiangsu and Jiangxi Province[J]. Journal of Agro-Forestry Economics and Management,2021,20(5):569-577.
[17]马超,曾剑波,朱莉,穆生奇,陈艳利,李婷,张莹,攸学松.北京西瓜产业发展40 年来回顾及展望[J].中国瓜菜,2022,35(2):112-117.MA Chao,ZENG Jianbo,ZHU Li,MU Shengqi,CHEN Yanli,LI Ting,ZHANG Ying,YOU Xuesong. Review and prospect of Beijing watermelon industry development in 40 years[J]. China Cucurbits and Vegetables,2022,35(2):112-117.