香榧(Torreya grandis)是我国特有的干果树种,常绿乔木,其果实榧子在食用及药用方面具有较高价值[1],市场前景十分广阔。其产地多分布在丘陵地带,安徽黄山是香榧主要产地之一。香榧人工林的可持续经营应考虑香榧种植的生态效益及其与环境的相互作用关系[2]。树木在受到水分胁迫情况下,树干径向会发生可逆收缩,树木径向停止生长,直到树体水分得到补充[3]。香榧生长发育会受到树体水分状态的作用,而树体水分状态会响应环境水热条件的变化[4],探究香榧对环境水热条件需求情况有助于指导香榧栽培[5]。目前对香榧分布的限制性因素认识仍然十分有限,对香榧分布与适生环境间的定量关系尚不清楚,香榧生长发育所需水分多采用粗放式灌溉进行供给,如何高效地进行香榧经济林经营管理是香榧种植过程中有待解决的问题。
使用定位监测的方法可以无损地实现对香榧树体水分状态实时监控及香榧是否受到水分胁迫做出判断。蒸腾耗水是树干水分流失的主要途径[6],也是土壤-植物-大气连续体水分循环运转的关键枢纽,树干液流可以较好地反映树体蒸腾耗水的水分轴向运动,是展示树体水分变化的高效指标[7]。目前香榧树干液流密度变化特征及其对环境水热因子响应的报道较少,香榧树干液流对环境因子响应特性有待进一步明晰。前人[8]进行香榧对环境因子响应研究发现香榧生理生态变化对持续高温响应显著,这种响应以19 d为观测时间窗口。但文献报道时间久远,在全球气候变化背景下,以19 d为观测时间窗口进行香榧水分对环境水热因子响应研究的可行性有待重新验证。本研究通过连续监测2 a 的香榧树干液流密度及主要环境因子变化数据,建立香榧树干液流与环境因子的定量关系,探究香榧树干液流对环境因子的响应特性是否会受到不同观测周期影响;对连续19 d高温下的树干液流对环境因子的响应与以年为观测时间标准的树干液流对环境因子响应是否一致进行验证,为香榧经济林生态定位监测提供理论借鉴。
1 材料和方法
1.1 研究区概况及数据采集
研究区位于安徽省宣城市绩溪县镇头林场(北纬30°9′14.4′′,东经118°31′37.6′′),平均海拔343.4 m,该区属于亚热带湿润季风气候,年平均降雨量为1 531.4 mm(1981—2021 年)。在为期2 a 的研究期间,由自动气象站所获取的年平均气温为18.3 ℃,年平均空气相对湿度为78.5%,年平均土壤温度为16 ℃,年平均土壤体积含水量为24.7%。土壤为山地黄壤,地形开阔度小。研究对象为17 a生香榧,主要经营目的为收获榧子,其由实生榧树优株通过人工嫁接繁殖而成,为从野外选育的优良无性系。对设置的样方(40 m×40 m)进行调查,81 株香榧平均基径为11.2 cm,选取6株长势、结实量接近样方平均水平的标准木。在标准木0.5 m 高度安装基于热扩散法测定树干液流密度的SF-G 型树干径流仪传感器。在6 株标准木旁选取适当位置,安装小型气象站。采用QT200 型自动气象站测定气温(Ta)、空气相对湿度(RH)、光合有效辐射(PAR)、土壤温度(Ts)、土壤体积含水量(SWC)、土壤电导率(SEC)。数据均使用CR1000 型数据采集器每15 min 记录1次。
1.2 数据处理与分析
使用数据采集器获取2019年4月1日—2021年3 月31 日的观测数据,并对获取数据进行处理与分析。树干液流密度由传感器测定温度值换算:Qs=0.714×[(△Tmax—△T)/△T]1.231。式中:Qs为树干液流密度;△T为2根探针间的温度差值;△Tmax为空气湿度最接近饱和情况下的△T。
根据Campbell等[9]介绍的饱和水汽压差(VPD)公式,使用Ta、RH 计算VPD。计算树干液流密度及环境因子的均值、标准差、标准误,计算变异系数:C.V.=SD/MN×100%。式中:C.V.为变异系数;SD为标准差;MN为均值。
将2 a 观测数据进行2 个时间周期的划分,以2019年4月1日—2020年3月31日的366 d为第1观测 周 期,以2020 年4 月1 日—2021 年3 月31 日 的365 d 为第2 观测周期,以2 a 观测数据为综合观测周期。以日最高气温(Tamax)>35 ℃为高温日,每个观测周期选取连续19 d高温日作为观测周期的连续高温日。第2 观测周期的连续高温日持续时间较长,持续日数为32 d。为增加不同观测周期的可比性,以第1 观测周期连续高温日进行相同日序的选取。选取2019 年8 月5 日—8 月23 日作为第1 观测周期连续高温日,2020 年相同日序时段作为第2 观测周期连续高温日。综合观测周期的连续高温日为2个观测周期连续高温日相加。
分别进行第1观测周期、第2观测周期及综合观测周期的树干液流密度与Ta、Tamax、RH、RHmax、VPD、PAR、Ts、SWC、SEC 的Pearson 相关分析、逐步回归分析,研究树干液流密度与不同环境因子间的相关性、不同环境因子对树干液流密度的解释与定量关系。分别进行第1观测周期高温日、第2观测周期高温日及综合观测周期高温日的树干液流密度与上述环境因子的Pearson 相关分析、逐步回归分析,同周期下分析数理统计结果,发现高温日与使用全年数据的观测周期进行树干液流密度对环境因子响应特性的异同点,确定在实验时长受限情况下使用高温日数据进行树干液流对环境因子响应研究是否具有可行性。数据分析使用SPSS 19.0,制图采用Origin 8.0,图中误差线采用数据标准误绘制。
2 结果与分析
2.1 香榧生长环境条件
由图1 可知,不同环境因子在第1 观测周期、第2观测周期具有相似变化特征。Ta在不同观测时期均呈现上升至峰值后下降、抵达谷值再上升的变化特征,峰值区间为6—8 月。2 个观测周期的极端高温均为43.7 ℃,第2 观测周期的极端高温发生时间(2019 年7 月26 日)相较第1 观测周期(2020 年8 月17日)有所滞后。不同观测周期的极端低温较为接近,第1观测周期最低气温为-13 ℃(2020年12月31日),第2观测周期最低气温为-12.9 ℃(2021年1月8日)。不同观测周期内,Ts与Ta均具有相同变化趋势,RH 与Ta 均呈反方向变化特征,PAR、VPD 整体呈单峰变化,峰值出现时间与Ta峰值出现时间较为接近。不同观测周期的SWC、SEC具有相同变化趋势,第2 观测周期的SWC 整体水平略高于第1 观测周期。Ta、VPD、PAR、Ts 在不同观测周期的变化幅度较为接近,在第1 观测周期的变异系数分别为53.6%、85.5%、78.5%、41.4%,在第2 观测周期的变异系数分别为56.7%、85.6%、76.4%、42.4%。第1观测周期RH、SWC、SEC 变异系数分别为11.8%、14.3%、29.8%,第2 观测周期RH、SWC、SEC 的变异系数分别为8.3%、13.8%、22.5%,3 个环境因子在第1观测周期比在第2观测周期具有更大变化幅度。

图1 不同观测周期的环境因子时期变化特征
Fig.1 Temporal variation characteristics of environmental factors in different observation periods
2.2 香榧树干液流密度变化特征
不同观测周期的树干液流密度具有不同变化特征(图2),第1 观测周期、第2 观测周期的树干液流密度变异系数分别为36.9%、34.2%,变化幅度较为接近。第1观测周期的树干液流密度在2019年9月到达谷值后开始上升,12 月初达到峰值,12 月至次年3月在0.48~4.97 mm3·cm-2·min-1范围内变化。第2 观测周期的树干液流密度从2020 年4 月初至5 月中旬处于谷值,7月初到达峰值,2020年7月初至次年3 月下旬在1.26~7.02 mm3·cm-2·min-1范围内变化。第1观测周期、第2观测周期的树干液流密度极大值分别为6.19 mm3·cm-2·min-1(2019年4月7日)、7.02 mm3·cm-2·min-1(2021年2月26日),同期较低的VPD可能加快树木的蒸腾作用,使得树干液流密度较高。第1观测周期、第2观测周期树干液流密度极小值分别为0.48 mm3·cm-2·min-1(2020年1月23日)、0.32 mm3·cm-2·min-1(2020年4月3日),春季雨水较多,空气中较高的水分含量导致香榧根压较低,蒸腾速率降低,使树干液流密度较低。第1观测周期连续高温日、第2观测周期连续高温日的平均树干液流密度分别为2.4、4.19 mm3·cm-2·min-1,第2 观测周期连续高温日的树干液流密度整体水平、变化幅度均高于第1 观测周期连续高温日。2 个观测周期连续高温日的树干液流密度与Tamax、RHmax变化趋势上未发现明显的响应特征。

图2 不同观测周期的香榧树干液流变化特征
Fig.2 Characteristics of stem sap flow of Torreya grandis in different observation periods
2.3 香榧树干液流密度对环境因子的响应
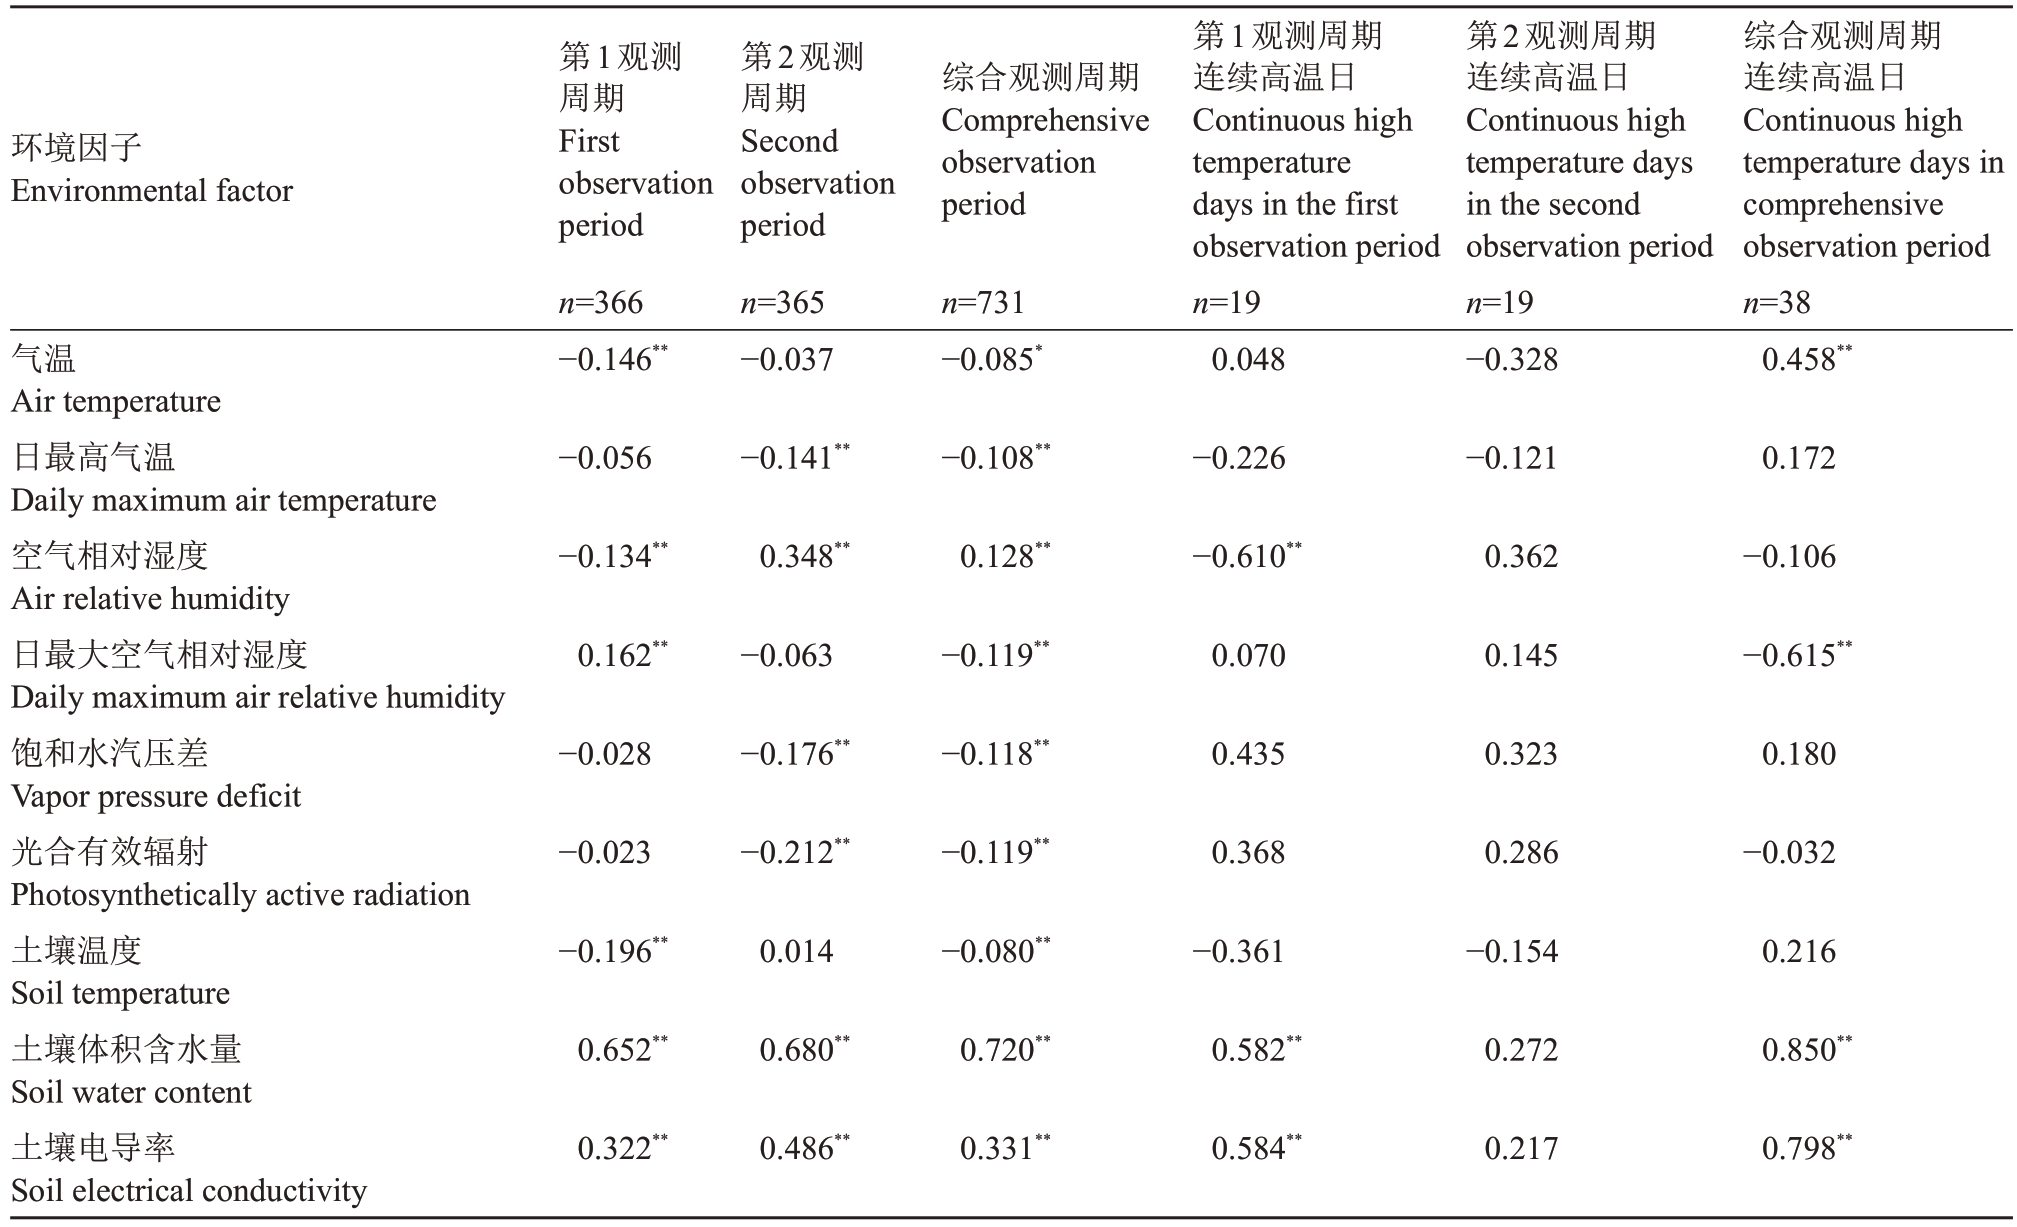
不同观测周期的树干液流密度与环境因子的相关性分析结果表明(表1),第1观测周期的树干液流密度与SWC(r = 0.65)、SEC(r = 0.32)、Ts(r =-0.20)、Ta(r=-0.15)、RH(r=-0.13)、RHmax(r=0.16)呈极显著相关(p ≤0.01)。第2观测周期的树干液流密度与SWC(r = 0.68)、SEC(r = 0.49)、RH(r =0.35)、PAR(r =-0.21)、VPD(r =-0.18)、Tamax(r =-0.06)呈极显著相关(p ≤0.01)。第2观测周期的树干液流密度与SWC、SEC 的相关程度高于第1 观测周期的树干液流密度与SWC、SEC的相关程度。综合观测周期的树干液流密度与Ta 呈显著相关(p ≤0.05),而与其他各因子均呈极显著相关(p ≤0.01),综合观测周期的各环境因子都对树干液流密度具有不同程度的解释作用。综合观测周期的树干液流密度与Ta(r=-0.09)呈显著相关(p ≤0.05),与其他环境因子的相关性均达到极显著水平(p ≤0.01)。第1观测周期、第2观测周期、综合观测周期的树干液流密度与SWC、SEC的相关性均最高。连续高温日的树干液流密度与环境因子的相关性与使用整个观测周期数据有所不同。第1观测周期连续高温日的树干液流密度与RH(r=-0.61)、SWC(r=0.58)、SEC(r=0.58)呈极显著相关(p ≤0.01)。第2观测周期连续高温日的树干液流密度与所有环境因子的相关性均不显著(p>0.05)。综合观测周期连续高温日的树干液流密度与SWC(r =0.85)、SEC(r =0.8)、RHmax(r=-0.62)、Ta(r=0.46)呈极显著相关(p ≤0.01)。
表1 树干液流密度与环境因子的相关性分析
Table 1 Correlation analysis between tree stem sap flow density and environmental factors

注:*p ≤0.05 和**p ≤0.01 分别表示相关性达显著和极显著水平。
Note:*p ≤0.05 and**p ≤0.01 mean significant correlations.
环境因子Environmental factor综合观测周期Comprehensive observation period气温Air temperature日最高气温Daily maximum air temperature空气相对湿度Air relative humidity日最大空气相对湿度Daily maximum air relative humidity饱和水汽压差Vapor pressure deficit光合有效辐射Photosynthetically active radiation土壤温度Soil temperature土壤体积含水量Soil water content土壤电导率Soil electrical conductivity第1观测周期First observation period n=366-0.146**第2观测周期Second observation period n=365-0.037 n=731-0.085*第1观测周期连续高温日Continuous high temperature days in the first observation period n=19 0.048第2观测周期连续高温日Continuous high temperature days in the second observation period n=19-0.328综合观测周期连续高温日Continuous high temperature days in comprehensive observation period n=38 0.458**-0.056-0.141**-0.108**-0.226-0.121 0.172-0.134**0.348**0.128**-0.610**0.362-0.106 0.162**-0.063-0.119**0.070 0.145-0.615**-0.028-0.176**-0.118**0.435 0.323 0.180-0.023-0.212**-0.119**0.368 0.286-0.032-0.196**0.014-0.080**-0.361-0.154 0.216 0.652**0.680**0.720**0.582**0.272 0.850**0.322**0.486**0.331**0.584**0.217 0.798**
2.4 香榧树干液流密度与环境因子的逐步回归分析
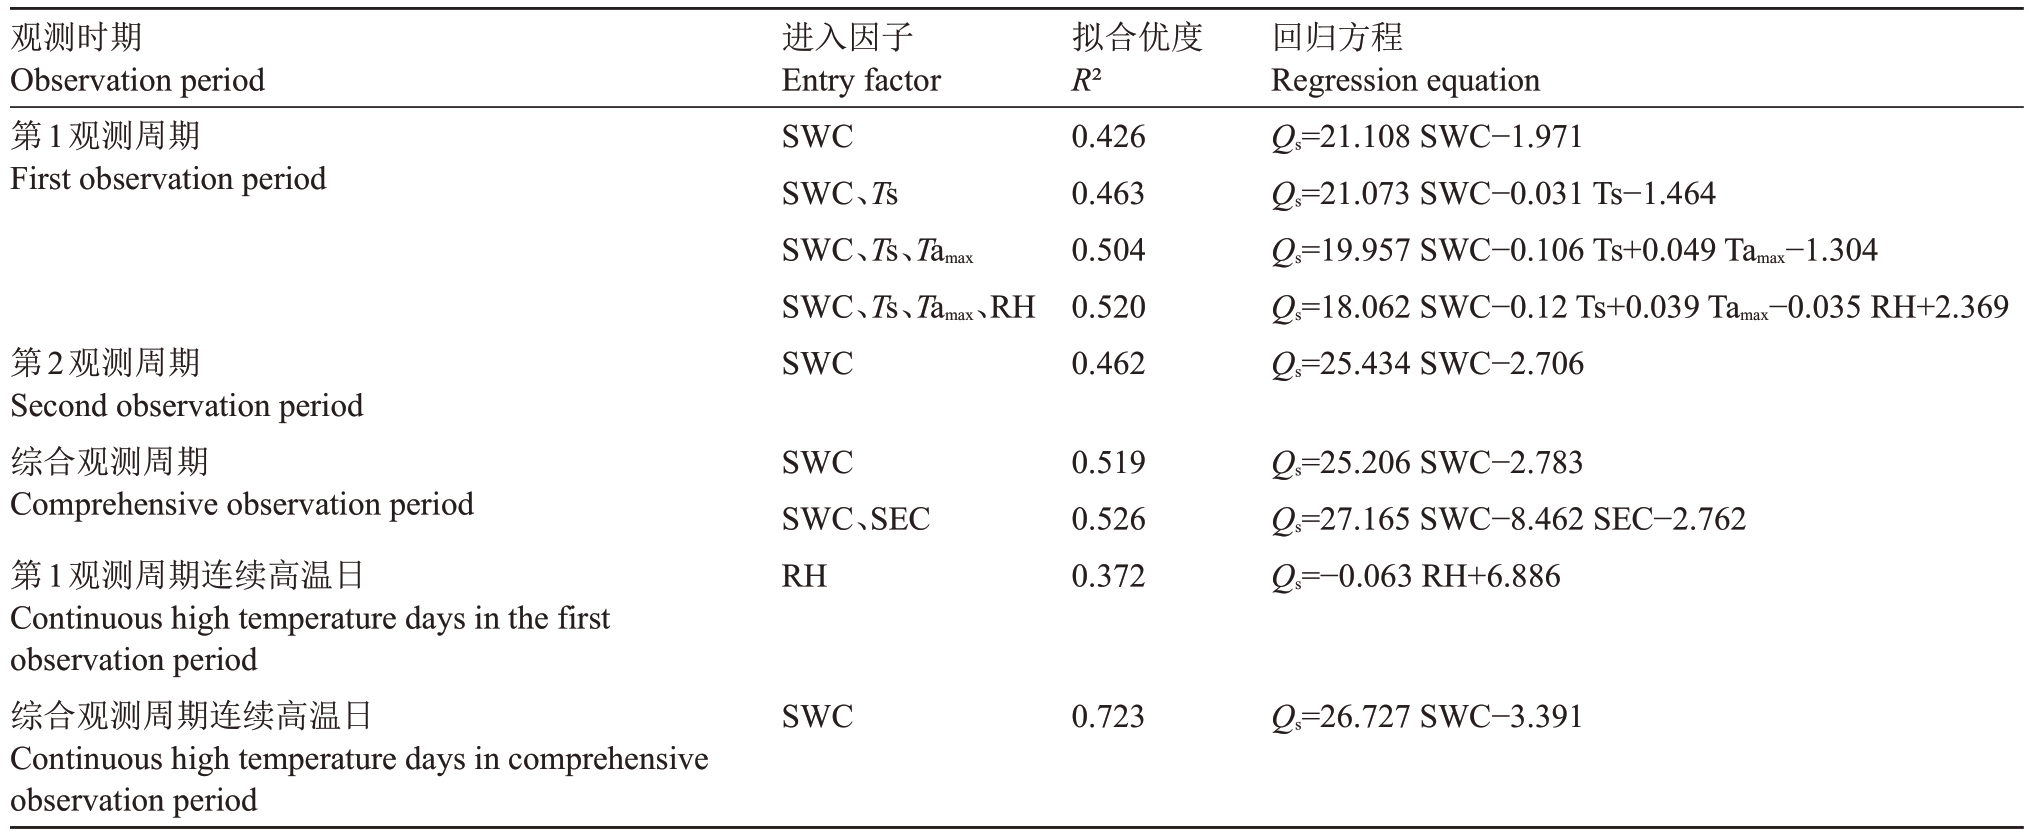
不同观测周期的树干液流密度与环境因子进行逐步回归分析(表2)。第1观测周期的逐步回归方程中,SWC、Ts、Tamax、RH 4个环境因子依次被引入,可以解释52%树干液流密度变化,SWC 可以解释42.6%的树干液流密度变化。第2观测周期的逐步回归方程中,只有SWC被引入,拟合优度为0.462。综合观测周期的树干液流密度与环境因子的逐步回归方程中,SWC、SEC依次被引入,当SEC被引入方程时,拟合优度由0.519 提升到0.526。第1 观测周期、第2观测周期、综合观测周期的香榧树干液流密度变化的主导因子为SWC。Tamax、RHmax对树干液流密度的解释作用较弱,Tamax、RHmax对香榧树干液流密度的作用表现在阈值限制,而不是参与定量分析。Tamax与液流密度在第1观测周期的相关性较为密切,第2观测周期、综合观测周期的树干液流密度与环境因子的回归分析中,没有因子进入方程。第1观测周期连续高温日的逐步回归方程中仅RH被引入,拟合优度为0.372。第2观测周期连续高温日的树干液流密度与环境因子的相关性达不到显著水平(p>0.05),使用回归分析方法无法建立树干液流密度与环境因子的定量关系。综合观测周期连续高温日的逐步回归方程中,仅有SWC被引入,拟合优度为0.723。
表2 不同观测时期的树干液流密度与环境因子的逐步回归分析
Table 2 Stepwise regression analysis of stem sap flow density and environmental factors in different observation periods

注:所有进入因子均达到极显著水平(p ≤0.01),SWC.土壤体积含水量;Ts.土壤温度;Tamax.日最高气温;RH.空气相对湿度;SEC.土壤电导率;Qs.树干液流密度。
Note:All entry factors reached a very significant level(p ≤0.01).SWC.Soil water content;Ts.Soil temperature;Tamax.Daily maximum air temperature;RH.Air relative humidity;SEC.Soil electrical conductivity;Qs.Stem sap flow density.
观测时期Observation period第1观测周期First observation period第2观测周期Second observation period综合观测周期Comprehensive observation period第1观测周期连续高温日Continuous high temperature days in the first observation period综合观测周期连续高温日Continuous high temperature days in comprehensive observation period进入因子Entry factor SWC SWC、Ts SWC、Ts、Tamax SWC、Ts、Tamax、RH SWC拟合优度R²0.426 0.463 0.504 0.520 0.462回归方程Regression equation Qs=21.108 SWC-1.971 Qs=21.073 SWC-0.031 Ts-1.464 Qs=19.957 SWC-0.106 Ts+0.049 Tamax-1.304 Qs=18.062 SWC-0.12 Ts+0.039 Tamax-0.035 RH+2.369 Qs=25.434 SWC-2.706 SWC SWC、SEC RH 0.519 0.526 0.372 Qs=25.206 SWC-2.783 Qs=27.165 SWC-8.462 SEC-2.762 Qs=-0.063 RH+6.886 SWC 0.723 Qs=26.727 SWC-3.391
3 讨 论
不同观测周期的环境因子对树干液流密度的解释作用不同[10]。水热因子变化具有以年为时间尺度的周期性变化特征,但不同周期的树干液流密度变化趋势可能受到多种因子的共同作用,不同周期的树干液流密度变化特征有所不同。孙旭等[11]发现油松(Pinus tabuliformis Carr.)树干液流变化主要响应Ts、SWC、RH的变化,该结果与本研究在第1观测周期的研究结果具有相似性,第1 观测周期的SWC、Ts、Tamax、RH 可共同解释树干液流密度的变化。但在第2观测周期的研究中,这4种环境因子却无法与树干液流密度变化建立定量关系,不同观测周期的树干液流密度具有不同的变化特征,这可能是第2观测周期极端低温较低,导致香榧受到低温胁迫,产生生理应答现象[12]。
树干液流密度对空气水热条件的响应要弱于对土壤水热条件的响应。PAR 与其他环境因子相比,对树干液流密度的解释作用较弱,这可能是由于树干液流密度、PAR的昼夜变化启动时间、达到峰值时间存在时滞现象[13-14]。在19 d 连续高温日的树干液流密度与环境因子的相关分析及回归分析中也发现了树干液流密度与环境因子间可能存在时滞效应。在第1观测周期连续高温日的研究中,RH可以在一定程度上解释树干液流密度的变化,这一结果与整个观测周期时长下的SWC 为树干液流密度主导因子不一致。在第2 观测周期连续高温日的研究中,环境因子无法解释树干液流密度的变化。2个观测周期连续高温日的研究结果表明,连续高温日时段由于观测时间较短等原因,不能准确分析树干液流对环境因子响应的特性。但在使用综合观测周期高温日38 d的数据进行树干液流密度对环境因子响应的研究时,SWC可以解释树干液流密度的变化。造成这一现象的原因可能是树干液流密度对环境因子的响应受到往年环境水热条件的作用,在扩大观测时间窗口的条件下,降低了往年环境水热条件对树干液流密度变化特征的影响。这一发现在综合观测周期下的SWC 对树干液流密度变化的解释程度也可以证明,综合观测周期下的SWC与液流密度呈极显著相关(p ≤0.01),SWC 对树干液流密度变化的解释程度(72.3%)要远高于SWC 在第1 观测周期(42.6%)、第2 观测周期(46.2%)对树干液流密度变化的解释程度。由于树干液流密度对环境因子响应受到树木往期生长的水热条件的生态记忆作用[15],使用多年观测数据进行香榧树干液流密度对环境因子响应特性的研究精度更高,响应特性更接近真实情况。Ts与SWC限制了树木根部可供吸取的水分,与树干液流关系密切[16],与本研究结果相一致,研究区受气候条件影响,Ts 整体水平相对较高,SWC 对香榧树干液流的主导作用被进一步加强。Ta、VPD、PAR 与树干液流密度变化具有一定的相关性[17],但在逐步回归方程的建立过程中均未被采用。Ta、VPD、PAR 对树干液流密度的解释作用可能通过间接效应的传导,体现在SWC对树干液流密度变化的作用之中[18]。
多种环境因子中,SWC是树干液流密度变化的驱动因子[19-20]。树干液流密度会受到土壤中可供树木利用的水分含量的限制[21-22],SWC 会影响到树木的根压、叶水势,从而影响树木的蒸腾能力[23],其在树体水分未饱和情况下决定树体水分的整体水平[18]。第1观测周期、第2观测周期、综合观测周期,SWC 都是对液流密度变化最具解释作用的因子。SWC 与香榧树干液流变化在不同观测周期均具有较强的相关性,可以建立定量关系,在变化趋势上二者具有一致性。在条件有限或节约观测成本的情况下,SWC变化情况的定位监测可以定量分析香榧树体水分状态的变化。
香榧生长发育会受到土壤盐碱化[24]作用,具有空间异质性的特点。笔者在本文中只对皖南地区香榧树干液流密度对环境因子的响应进行研究,树干液流密度对环境因子的响应的研究结果需要在其他香榧种植地区进一步验证,提高本研究发现地香榧树干液流密度对环境因子响应特性的普遍适用性,将研究结果进行统摄性归纳。
4 结 论
以年为时间尺度的不同观测周期的香榧树干液流对环境水热因子的响应不同。在条件允许的情况下,使用多年观测数据进行香榧树干液流密度对环境因子响应特性的研究精度更高。树干液流密度对土壤层面水热因子的响应较强,在条件有限或节约观测成本的情况下,SWC变化情况的定位监测可以定量分析香榧树体水分状态的变化。采用19 d连续高温日进行香榧树干液流密度对环境因子的响应的研究时间较短,不能准确地分析树干液流对环境因子响应的特性。
[1] WANG H,LI Y,WANG R,JI H F,LU C Y,SU X R.Chinese Torreya grandis cv.Merrillii seed oil affects obesity through accumulation of sciadonic acid and altering the composition of gut microbiota[J].Food Science and Human Wellness,2022,11(1):58-67.
[2] CHEN X,CHEN H.Comparing environmental impacts of Chinese Torreya plantations and regular forests using remote sensing[J].Environment,Development and Sustainability,2021,23(1):133-150.
[3] ZWEIFEL R,HAENI M,BUCHMANN N,EUGSTER W.Are trees able to grow in periods of stem shrinkage?[J].New Phytologist,2016,211(3):839-849.
[4] 薛峰,江源,董满宇,王明昌,丁新原,杨显基,崔明皓,康慕谊.不同去趋势方法对基于Dendrometer 数据的茎干水分动态分析的影响:以白扦为例[J].植物生态学报,2021,45(8):880-890.XUE Feng,JIANG Yuan,DONG Manyu,WANG Mingchang,DING Xinyuan,YANG Xianji,CUI Minghao,KANG Muyi.Influence of different de-trending methods on stem water relations of Picea meyeri derived from Dendrometer measurements[J].Chinese Journal of Plant Ecology,2021,45(8):880-890.
[5] 王小明,王珂,秦遂初,蒋玉根.香榧适生环境研究进展[J].浙江林学院学报,2008,25(3):382-386.WANG Xiaoming,WANG Ke,QIN Suichu,JIANG Yugen.Review of research on favorable environmental factors of Torreya grandis‘Merrillii’[J].Journal of Zhejiang A & F University,2008,25(3):382-386.
[6] 党宏忠,冯金超,王檬檬,陈帅,却晓娥.黄土高原苹果树各生育期需水特征研究[J].果树学报,2020,37(5):659-667.DANG Hongzhong,FENG Jinchao,WANG Mengmeng,CHEN Shuai,QUE Xiao’e.A study on water demand characteristics of apple trees in different growing stages in the Loess Plateau Area[J].Journal of Fruit Science,2020,37(5):659-667.
[7] NADEZHDINA N,DAVID J S,PINTO C A,DAVID T S.Root sap flow as a tool to establish hydrological thresholds for plant growth and survival[J/OL].Agricultural Water Management,2020,241:106388.DOI:10.1016/j.agwat.2020.106388.
[8] 傅雨露,章先洋,黄岳夫.香榧产量与气象因子的关系分析[J].上海农业科技,1999(1):69-70.FU Yulu,ZHANG Xianyang,HUANG Yuefu.Analysis on the relationship between Torreya grandis yield and meteorological factors[J].Shanghai Agricultural Science and Technology,1999(1):69-70.
[9] CAMPBELL G S,NORMAN J M.Introduction to environmental biophysics[M].New York:Springer Science and Business Media,2001.
[10] 刘朋飞,郭浩,辛智鸣.乌兰布和沙漠沙枣树干液流与环境因子关系[J].干旱区资源与环境,2021,35(9):177-184.LIU Pengfei,GUO Hao,XIN Zhiming.The relationship between the stem sap flow of Elaeagnus angustifolia Linn.and environmental factors in Ulan Buh Desert[J].Journal of Arid Land Resources and Environment,2021,35(9):177-184.
[11] 孙旭,杨文慧,焦磊,李宗善,周伟奇,王效科,张咏,王傲雪.不同时间尺度北京蟒山油松树干液流对环境因子的响应研究[J].生态学报,2022,42(10):1-11.SUN Xu,YANG Wenhui,JIAO Lei,LI Zongshan,ZHOU Weiqi,WANG Xiaoke,ZHANG Yong,WANG Aoxue.Relationships between sap flux density of Pinus tabuliformis trees and environmental factors at different temporal scales in Mangshan National Forest Park of Beijing,China[J].Acta Ecologica Sinica,2022,42(10):1-11.
[12] KÖRNER C,BASLER D,HOCH G,KOLLAS C,LENZ A,RANDIN C F,VITASSE Y,ZIMMERMANN N E.Where,why and how?Explaining the low-temperature range limits of temperate tree species[J].Journal of Ecology,2016,104(4):1076-1088.
[13] 江振斌,廖康,庞洪翔,曼苏尔·那斯尔,赵世荣,杜润清,董胜利.‘库尔勒香梨’3 种树形树干液流变化及其与气象因子的关系[J].果树学报,2016,33(7):814-822.JIANG Zhenbin,LIAO Kang,PANG Hongxiang,Mansuer ·Nasier,ZHAO Shirong,DU Runqing,DONG Shengli.Sap flow changes in‘Kuerle Xiangli’trees with three different canopy shapes and their relationships with climatic factors[J].Journal of Fruit Science,2016,33(7):814-822.
[14] 夏银华,章新平,戴军杰,王锐,罗紫东.亚热带季风区樟树蒸腾与气象因子之间的时滞效应[J].水土保持学报,2021,35(5):194-203.XIA Yinhua,ZHANG Xinping,DAI Junjie,WANG Rui,LUO Zidong.Time-lag effects between meteorological factors and transpiration of Cinnamomum camphora in the subtropical monsoon region[J].Journal of Soil and Water Conservation,2021,35(5):194-203.
[15] PRETZSCH H.Trees grow modulated by the ecological memory of their past growth.consequences for monitoring,modelling,and silvicultural treatment[J].Forest Ecology and Management,2021,487:118982.
[16] 王玥,鄢春华,邱国玉.土壤温度对油松树干液流启动与停止的影响[J].北京大学学报(自然科学版),2019,55(3):580-586.WANG Yue,YAN Chunhua,QIU Guoyu.Soil temperature triggers sap flow onset and offset of Pinus tabulaeformis[J].Acta Scientiarum Naturalium Universitatis Pekinensis,2019,55(3):580-586.
[17] 刘浩,张秋良,田原.兴安落叶松天然林蒸腾特征及其影响因素研究[J].西北农林科技大学学报(自然科学版),2021,49(10):56-63.LIU Hao,ZHANG Qiuliang,TIAN Yuan.Transpiration characteristics and influencing factors of natural Larix gmelinii stand[J].Journal of Northwest A&F University (Natonal Science Edition),2021,49(10):56-63.
[18] FLO V,MARTÍNEZ-VILALTA J,MENCUCCINI M,GRANDA V,ANDEREGG W R L,POYATOS R.Climate and functional traits jointly mediate tree water-use strategies[J].New Phytologist,2021,231(3):617-630.
[19] VENTURIN A Z,GUIMARÃES C M,DE SOUSA E F,FILHO J A M,RODRIGUES W P,SERRAZINE Í A,BRESSANSMITH R,MARCIANO C R,CAMPOSTRINI E.Using a crop water stress index based on a sap flow method to estimate water status in conilon coffee plants[J/OL].Agricultural Water Management,2020,241:106343.DOI:10.1016/j.agwat.2020.106343.
[20] 黄雅茹,马迎宾,辛智鸣,罗凤敏,刘湘杰,李永华,张雅楠.柽柳不同季节树干液流特征及其与土壤含水量及土壤温度的关系[J].西北林学院学报,2021,36(5):1-10.HUANG Yaru,MA Yingbin,XIN Zhiming,LUO Fengmin,LIU Xiangjie,LI Yonghua,ZHANG Ya’nan.Flow characteristics of Tamarix chinensis tree trunk fluid in different seasons and the relationships with soil water content and soil temperature[J].Journal of Northwest Forestry University,2021,36(5):1-10.
[21] CAO Q Q,LI J R,XIAO H J,CAO Y B,XIN Z M,YANG B M,LIU T,YUAN M T.Sap flow of Amorpha fruticosa:implications of water use strategy in a semiarid system with secondary salinization[J/OL].Scientific Reports,2020,10(1):13504.https://doi.org/10.1038/s41598-020-70511-2.
[22] HONG L,GUO J B,LIU Z B,WANG Y H,MA J,WANG X,ZHANG Z Y.Time-lag effect between sap flow and environmental factors of Larix principis-rupprechtii Mayr.[J/OL].Forests,2019,10(11):971.DOI:10.3390/F10110971.
[23] 武小飞,杨帆,岩晓莹,郭天崎,朱谧远,黄明斌.土壤-刺槐系统水流阻力对水分胁迫的响应[J].水土保持研究,2022,29(2):274-280.WU Xiaofei,YANG Fan,YAN Xiaoying,GUO Tianqi,ZHU Miyuan,HUANG Mingbin.Response of hydraulic resistances of soil-Robinia pseudoacacia system to water stress[J].Research of Soil and Water Conservation,2022,29(2):274-280.
[24] LI T T,HU Y Y,DU X H,TANG H,SHEN C H,WU J S,ZHANG J S.Salicylic acid alleviates the adverse effects of salt stress in Torreya grandis cv.Merrillii seedlings by activating photosynthesis and enhancing antioxidant systems[J/OL].PLoS ONE,2014,9(10):e109492.DOI:10.1371/journal.pone.0109492.